

Key takeaways
Bitcoin slipped below $77,000 earlier on Wednesday after failing to break above the 200-day moving average near $82,000, as rising inflation and tighter macroeconomic conditions weighed heavily on risk assets.
The decline comes after hotter-than-expected U.S. inflation data showed Consumer Price Index (CPI) growth accelerating to 3.8% year-over-year. At the same time, rising oil prices and a surge in the 10-year Treasury yield have reduced expectations for Federal Reserve rate cuts, with markets increasingly pricing in the possibility of a rate hike by December.
According to a report from K33 Research, Bitcoin’s rejection at the 200-day moving average mirrors patterns seen during previous market cycles in 2014, 2018, and 2022, when rapid rebounds were followed by sharp deleveraging-driven sell-offs.
K33 noted that those historical recoveries rebuilt trader confidence and leverage quickly, leaving markets vulnerable to aggressive corrections once momentum faded.
“A core ingredient in the ensuing legs lower was the unwind of positions built up during the rally itself,” the report stated.
However, analysts emphasized that the current cycle differs in several important ways. Bitcoin took significantly longer to revisit the 200-day moving average after breaking below it, spending 189 days before retesting the level in May. That compares with 96 days in 2014, 132 days in 2018, and 85 days in 2022.
Derivatives data suggest traders remain cautious rather than excessively bullish. Funding rates have stayed negative for 81 consecutive days, while options market skews are hovering near yearly highs, indicating persistent defensive positioning.
Institutional flows have presented a mixed picture. Global Bitcoin exchange-traded products (ETPs) recorded their largest weekly outflow of the year last week, totaling 24,303 BTC. The figure marked the ninth-largest five-day outflow since the launch of U.S. spot Bitcoin ETFs.
K33 noted that selling pressure intensified as Bitcoin approached the average ETF cost basis, a level that has historically triggered elevated outflows.
At the time of writing, Bitcoin is hovering near $77200, slightly above the 50-day EMA at $76,743 and the 100-day EMA at $76,867.
However, the broader trend remains constrained by the 200-day EMA at $81,845, which continues to act as a strong overhead resistance level.
This positioning suggests that while short-term buyers are attempting to stabilize price action, longer-term trend signals have yet to confirm a bullish reversal.
Technical indicators point to declining bullish momentum. The Relative Strength Index (RSI) is drifting toward the mid-40s, indicating weakening buying pressure without yet reaching oversold conditions.
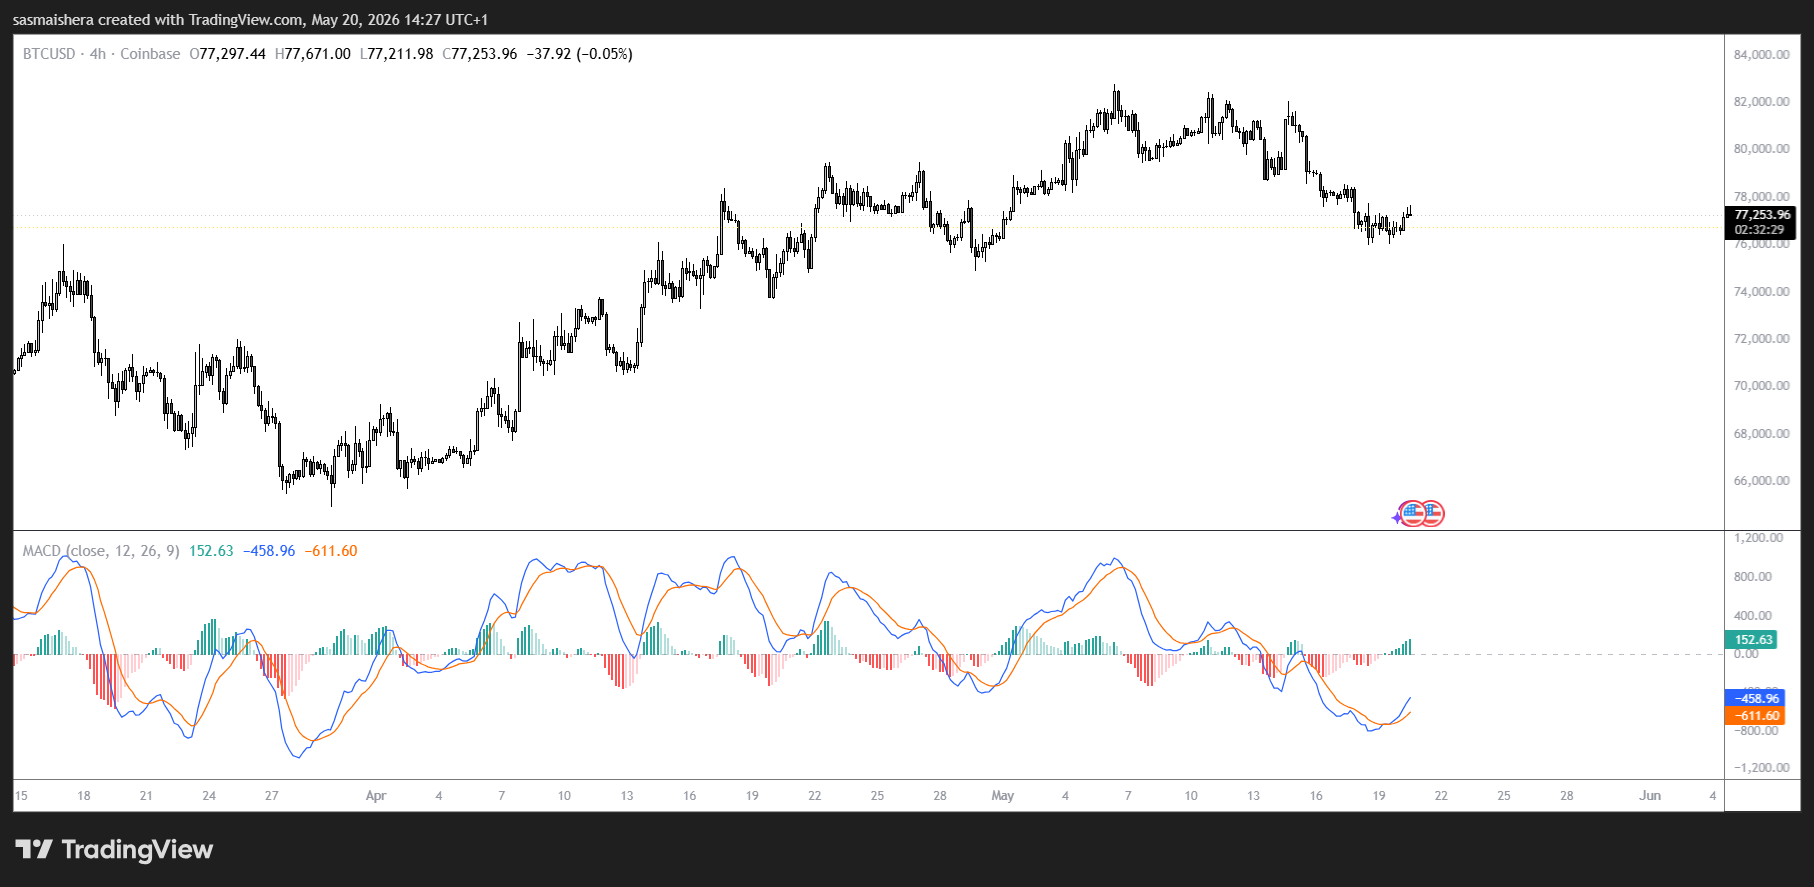
Meanwhile, the Moving Average Convergence Divergence (MACD) remains firmly in negative territory, reinforcing the view that recent upward moves have lost strength following the prior rally attempt.
If the rally resumes, immediate resistance is located at the 50% Fibonacci retracement level of the recent rally around $78,962. A breakout above this zone would be needed to challenge higher levels.
However, if the selloff continues, initial support is anchored by the 50-day EMA at $76,743. A break below this level could expose Bitcoin to further losses toward the 38.2% Fibonacci retracement at $74,487.
Deeper support lies near the reclaimed trendline around $70,785, with the 23.6% retracement level at $68,950 acting as a final key cushion for the current structure.
The post Bitcoin stays around $77K after 200-day moving average rejection appeared first on CoinJournal.


The consultation could reshape EU crypto regulation, impacting stablecoin interest, DeFi oversight, and asset classification, influencing global standards. The post European Commission opens consultation on
The Act reshapes digital content regulation, challenging decentralized platforms and raising compliance costs for new social media ventures. The post Take It Down Act mandates
Burnham’s candidacy could reshape Labour’s internal power dynamics, influencing future leadership and policy directions within the party. The post Andy Burnham enters Makerfield by-election, impacting
The European Commission is seeking feedback on whether the EU’s landmark crypto regulatory framework remains suitable as digital asset markets and global policies evolve.