Ethereum (ETH) price trades at $2,132 on May 22, holding flat after a small rebound off recent lows. The action masks a deeper split between two on-chain cohorts pulling in opposite directions.
The price chart, whale supply data, and conviction holder behavior each tell different stories. Resolving the conflict points to one of two outcomes for Ethereum in the coming sessions.
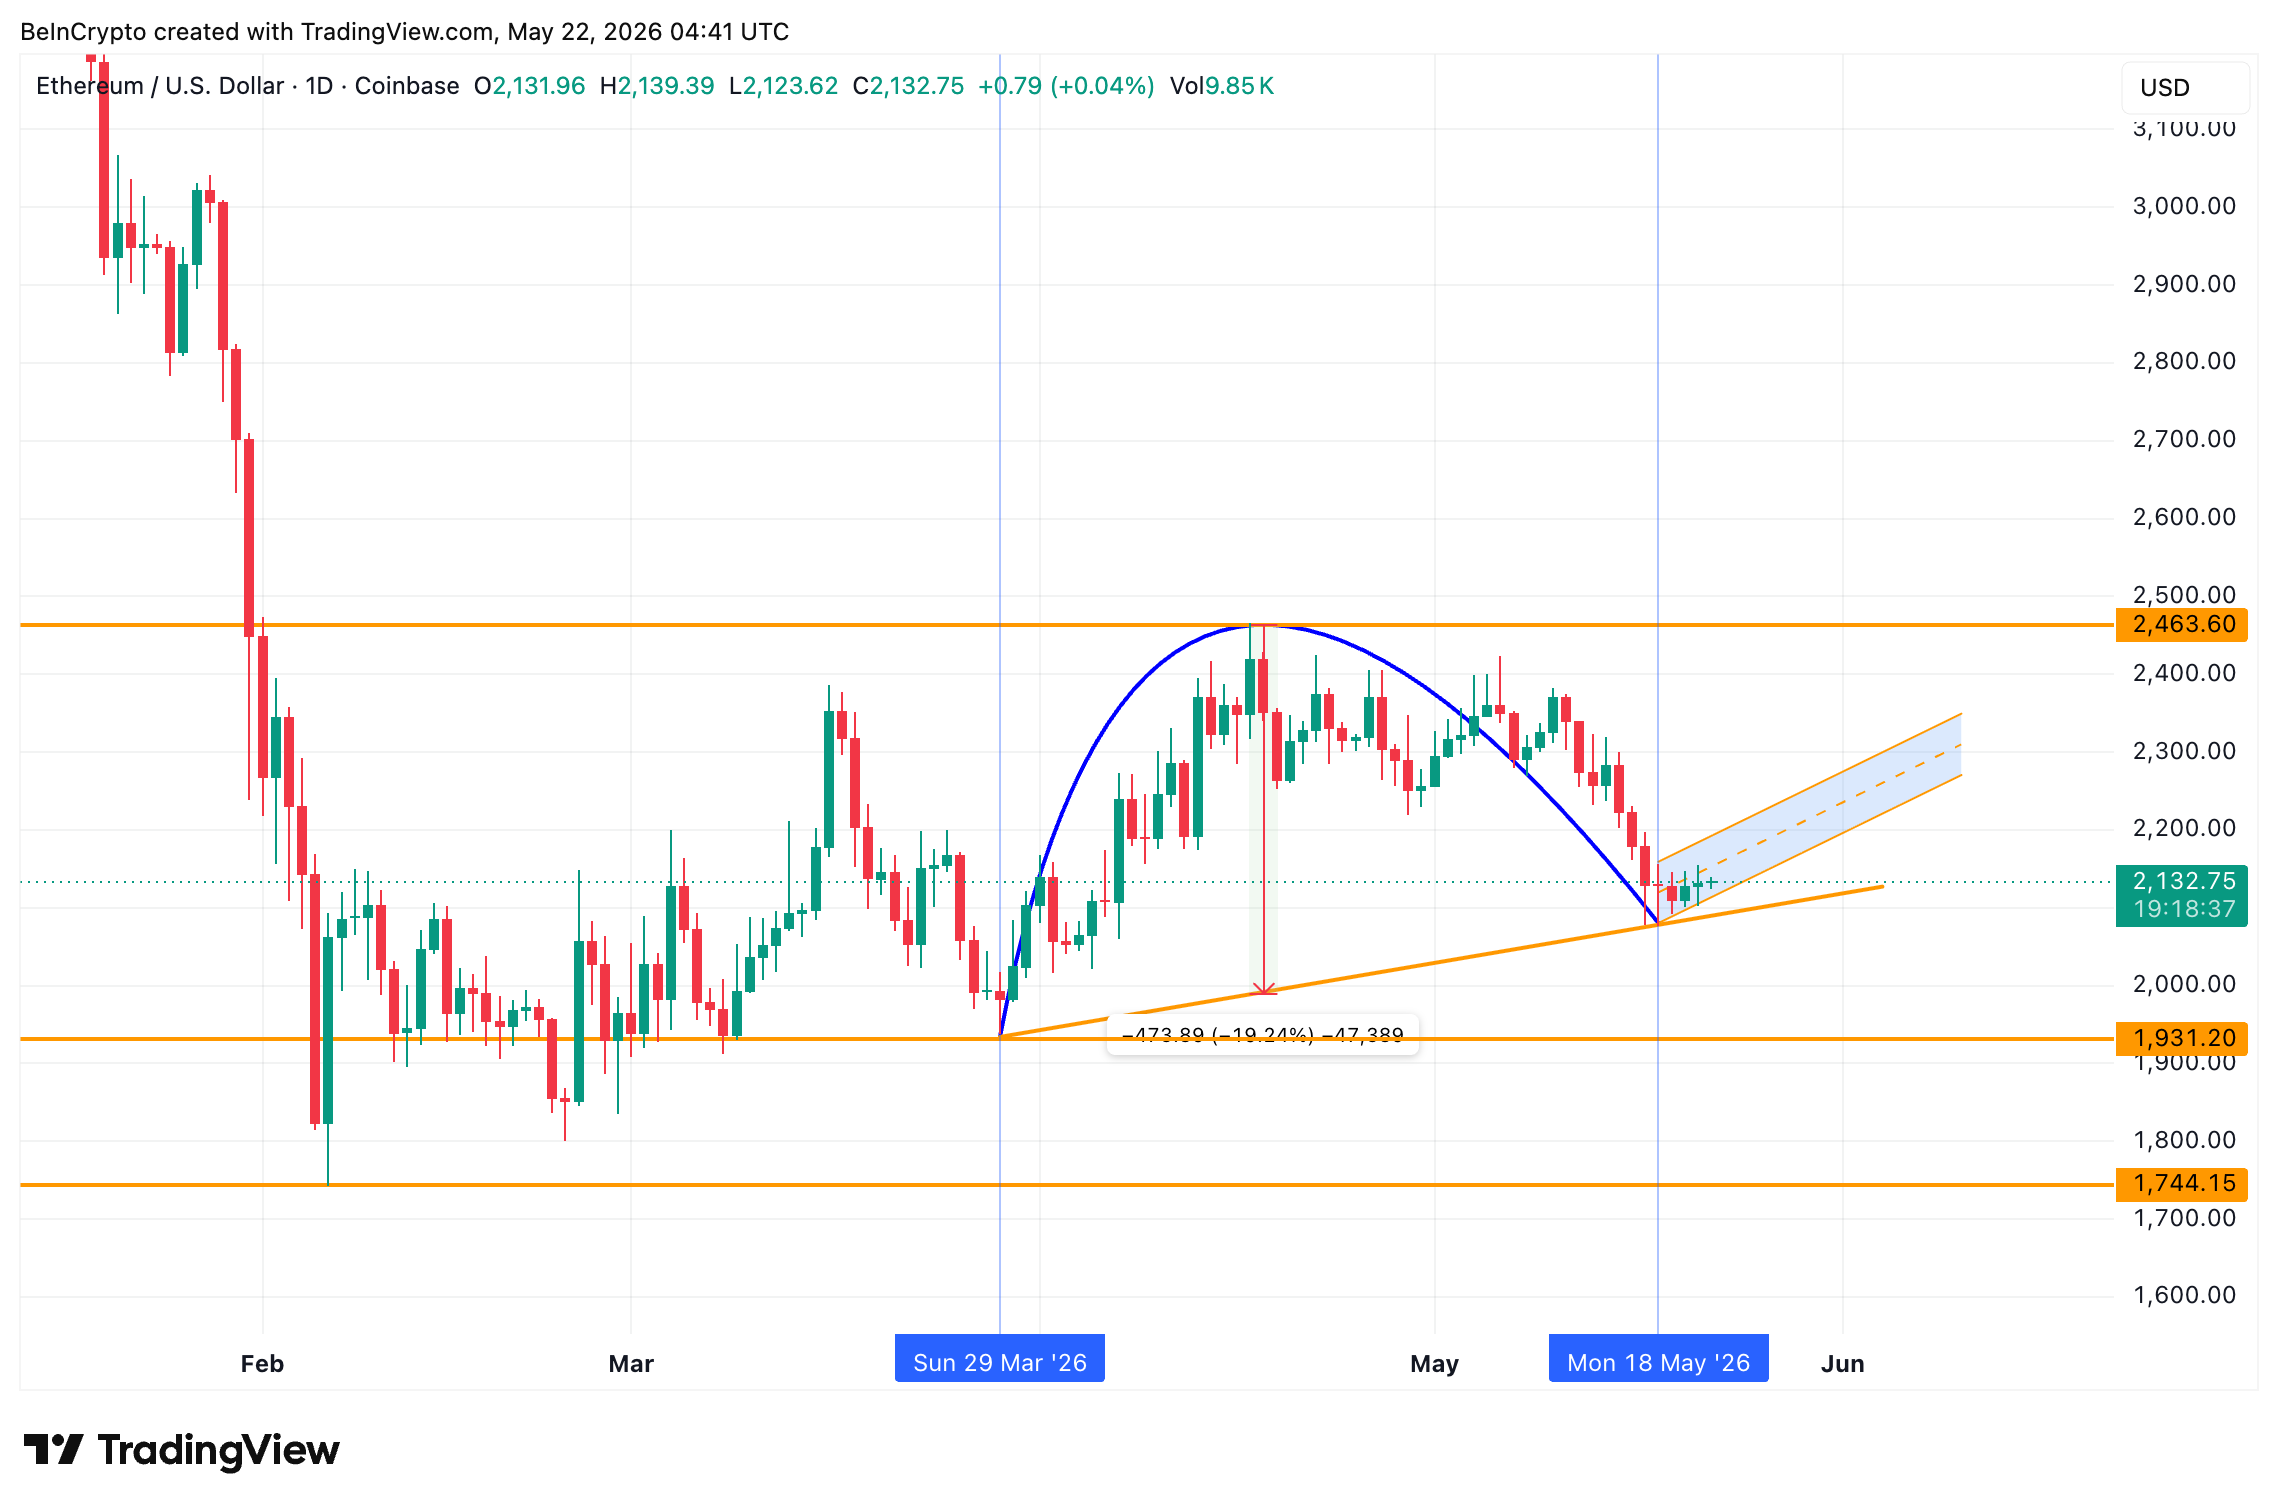
Ethereum has been trading inside an inverted cup and handle since March 29. The pattern is a bearish reversal formation where price climbs in a rounded arc before rolling over. The cup completed near May 18, with the small rebound since then forming the handle.
If the handle gives way, the measured move points to a 19% correction. The downside math would set up a cycle reset for Ethereum back to early February territory.
Want more token insights like this? Sign up for Editor Harsh Notariya’s Daily Crypto Newsletter here.
Ethereum whales have been adding pressure to that scenario. Santiment data shows the supply held by whales (exchanges excluded) sat at 125.36 million ETH on May 17. The reading has since drifted to 125.02 million. This is a drop worth $725 million at the current ETH price.
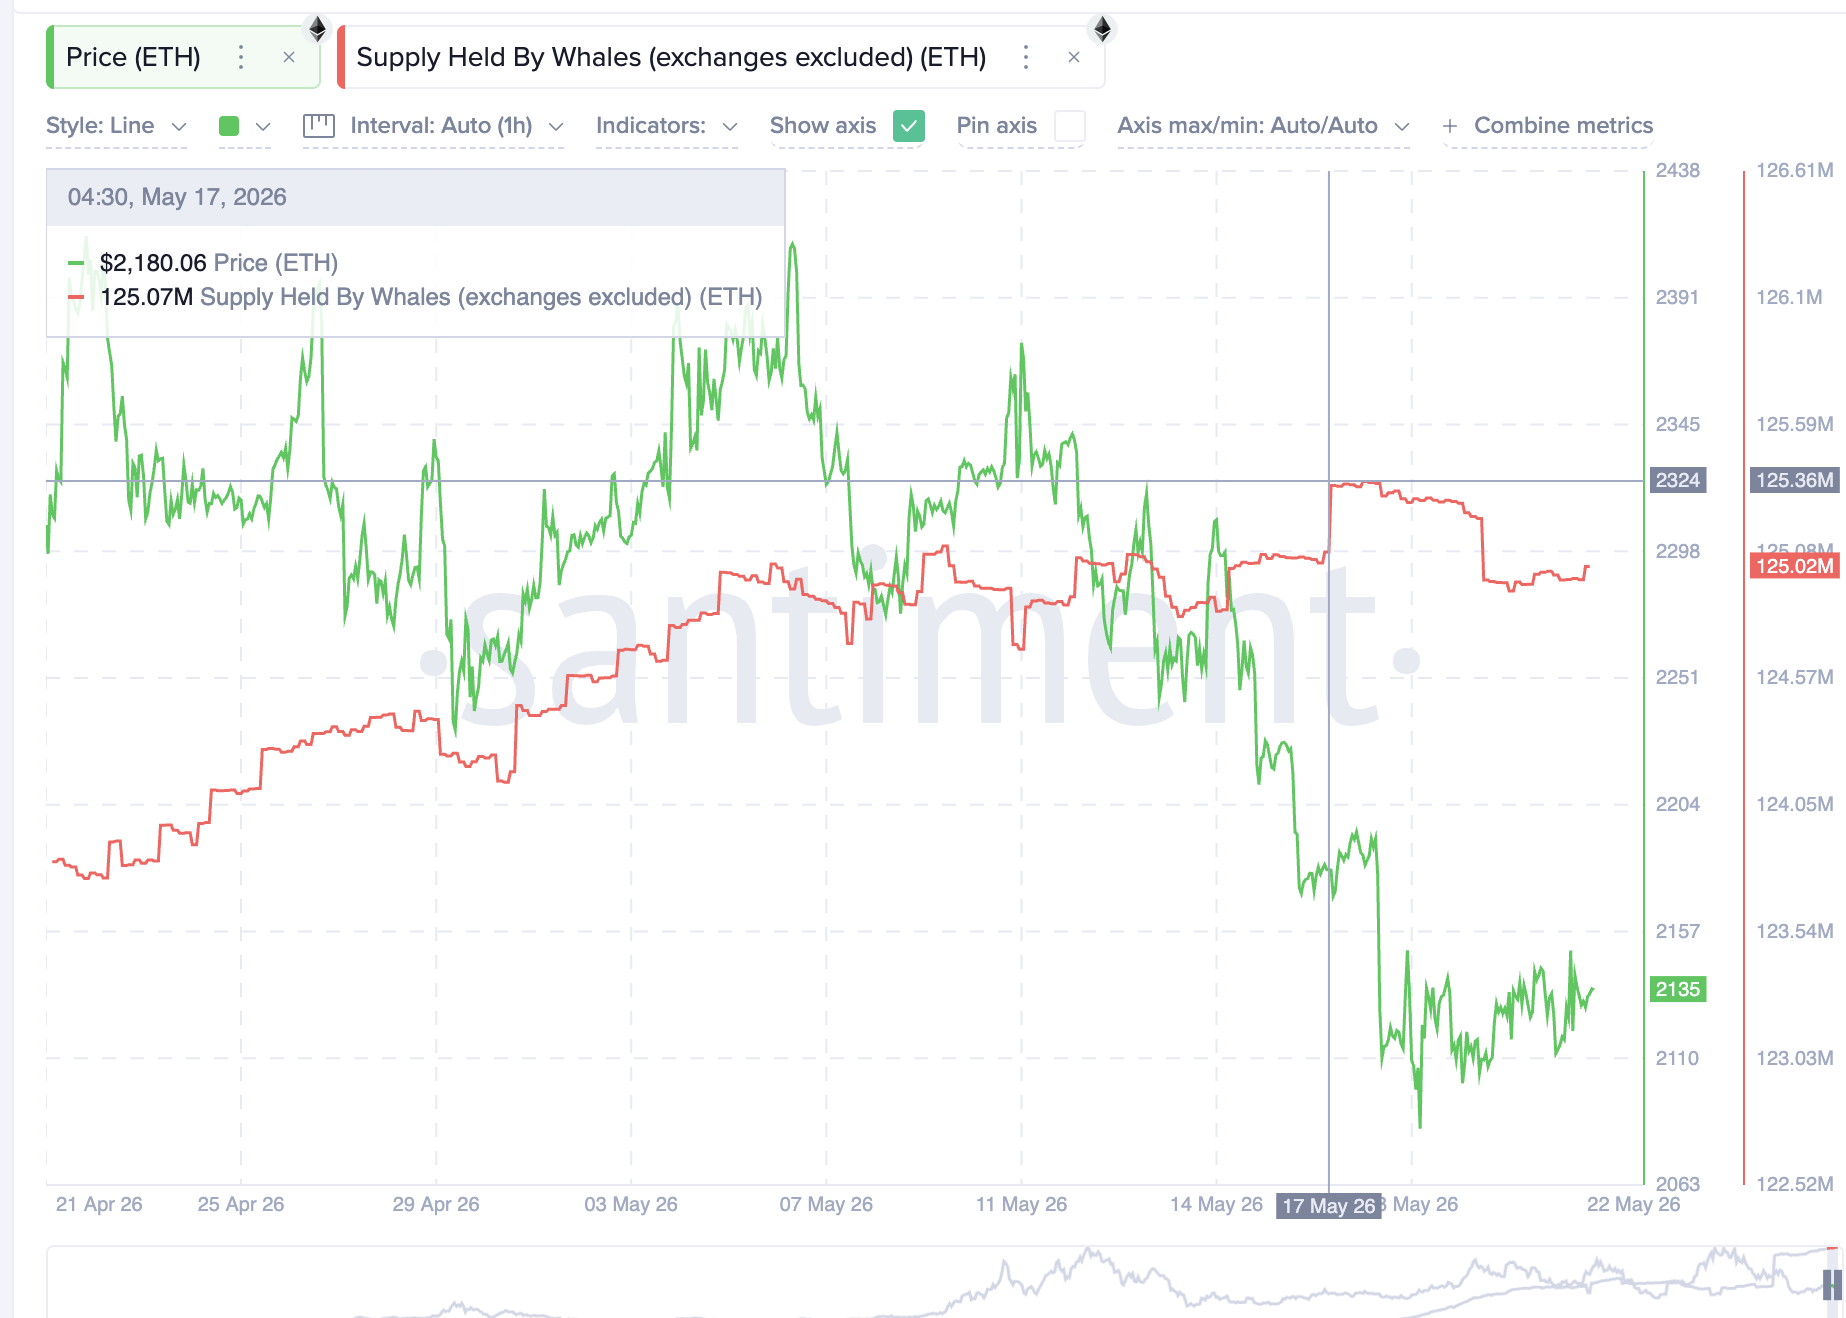
The whale exit started in mid-May, coinciding exactly with the cup completion phase. That timing suggests the largest stack is rotating out as the pattern matures.
The whale read validates the bearish technical setup, but a separate cohort tells a contradictory story.
The Smart Money Index measures informed-investor conviction by comparing trading patterns. The reading currently sits below its zero line. That signals institutional and informed buyers have not returned, even with the small rebound since May 18.
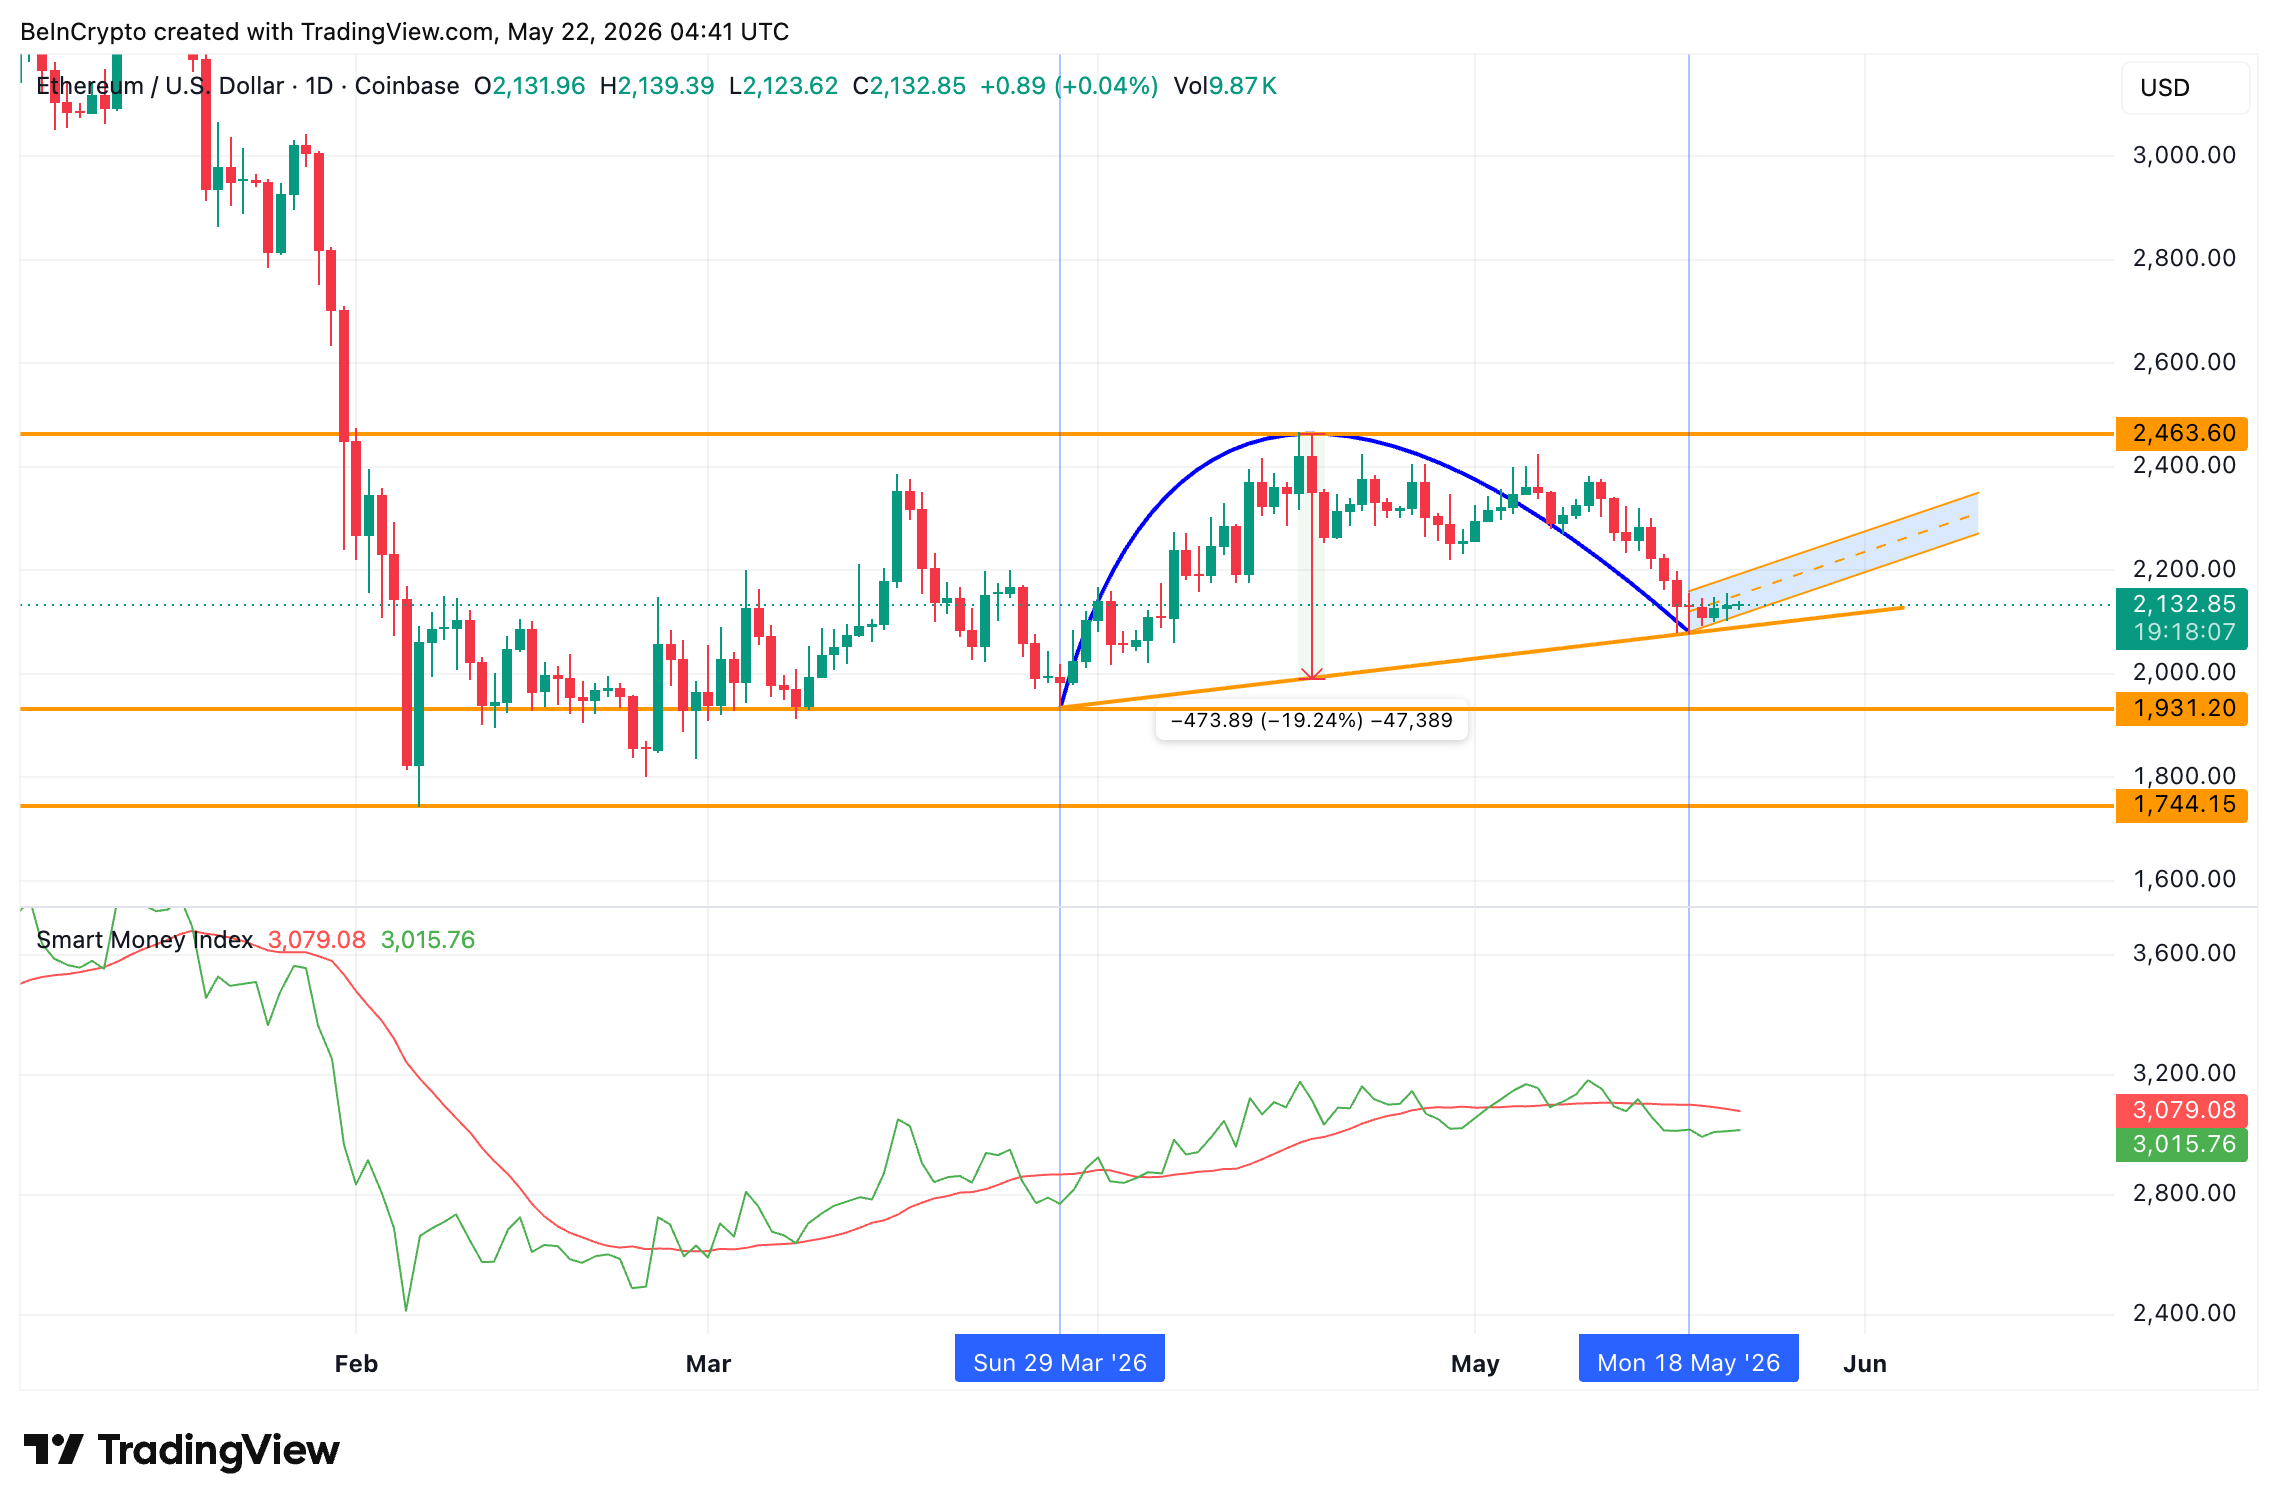
This reinforces the bearish read from the pattern and the whale exit.
However, Ethereum hodlers, ones with a stash older than 155 days, moved in the opposite direction. The Hodler Net Position Change rose from 77,978 ETH on May 16 to 151,890 ETH by May 21. That works out to a 95% jump in conviction-holder accumulation over five days.
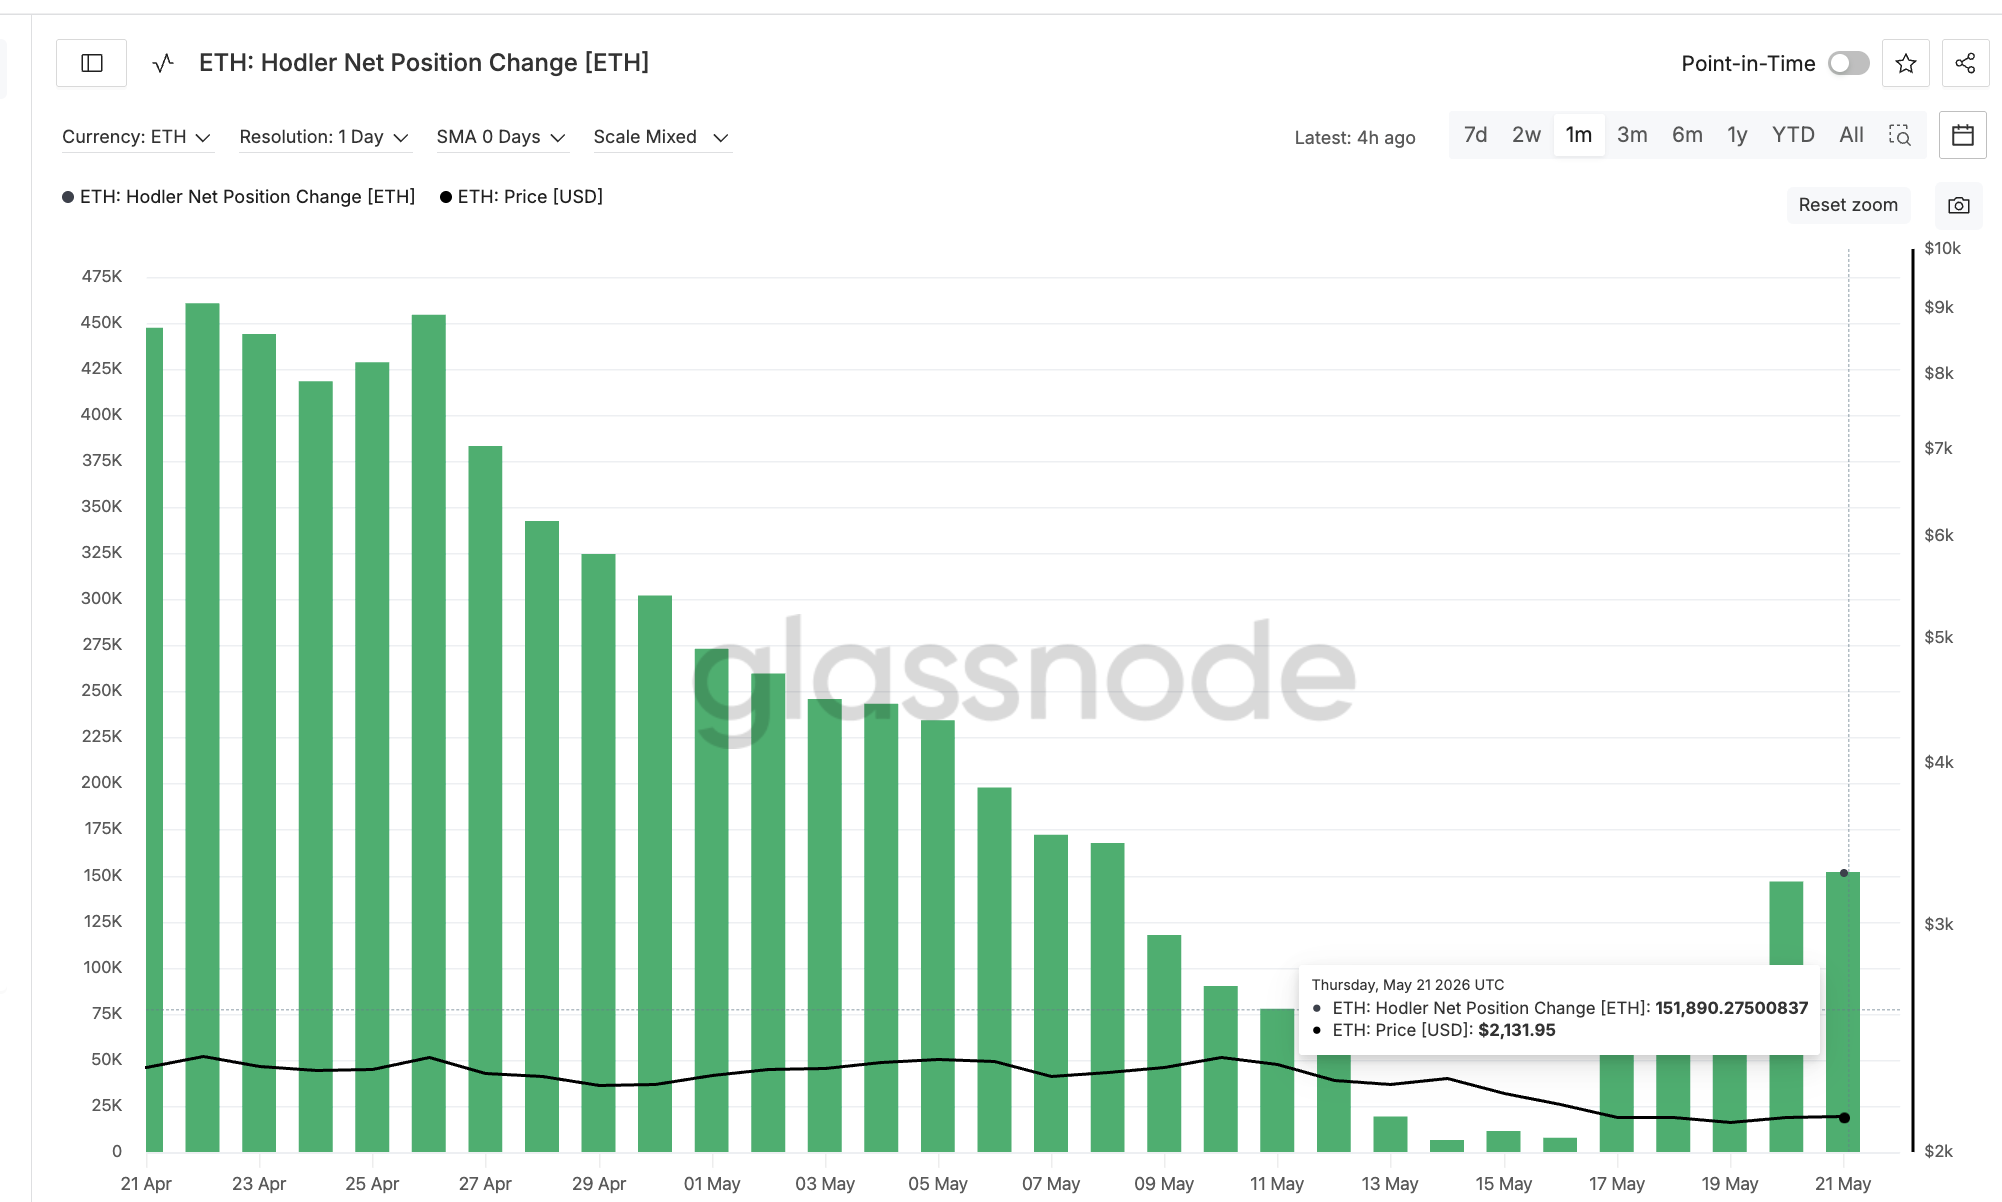
Whales sell, smart money waits, hodlers stack. The hodler buying looks paradoxical, but the cost basis distribution map explains why.
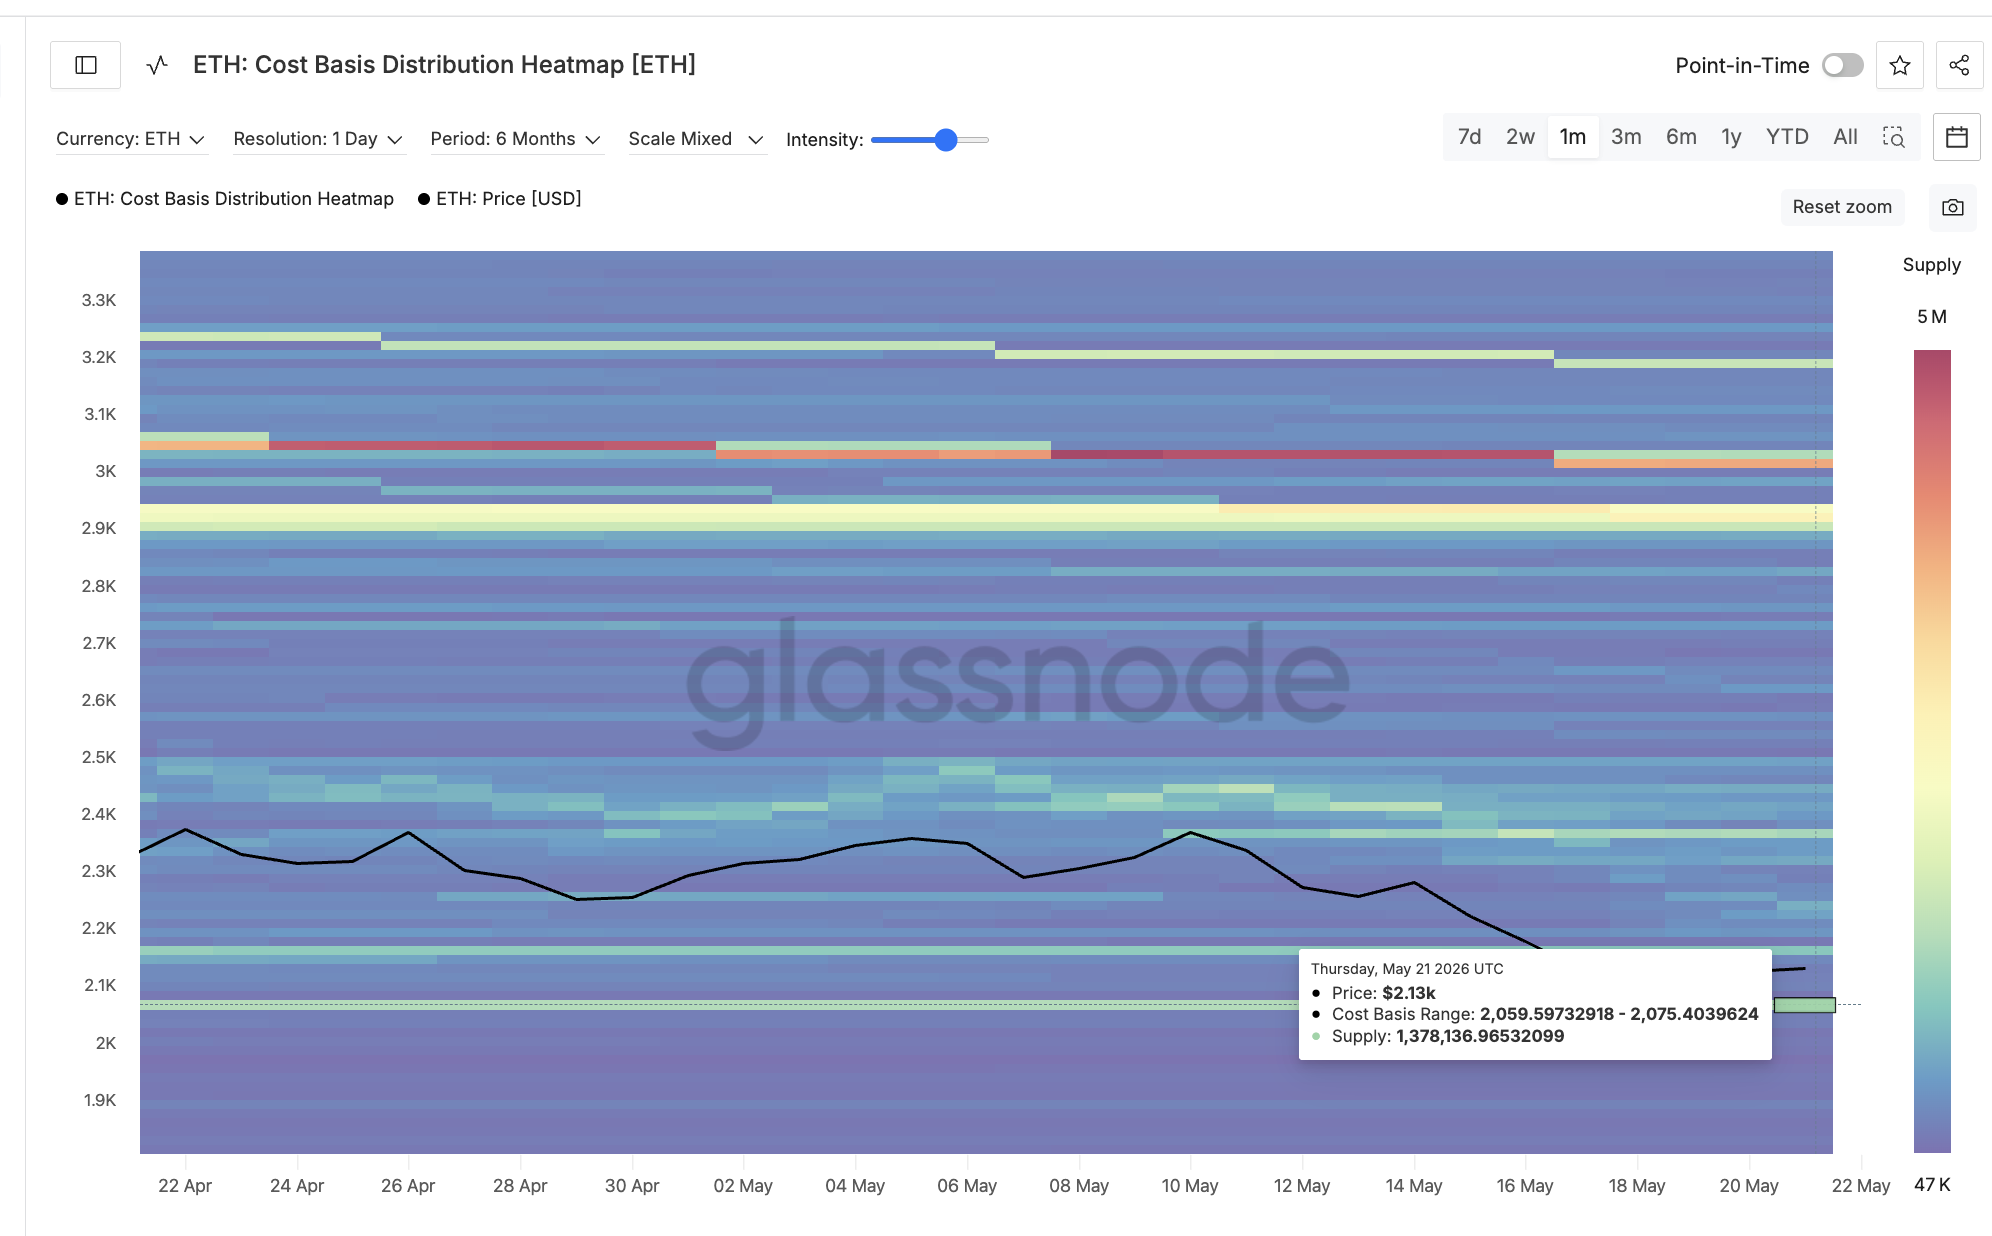
The Glassnode cost basis heatmap shows a concentrated cluster at the $2,059 to $2,075 zone. Roughly 1.378 million ETH sits at that Ethereum cost basis range, the only meaningful supply cluster anywhere near the current price.
Hodlers are defending this floor. If the price holds above the cluster, their positions stay green, and the bid keeps showing up. If the cluster breaks, the conviction wave likely reverses.
The handle’s structural support sits at $2,102. A clean loss of $2,102 sends the price directly into the cost basis cluster. Below $2,059, the next stops are $2,017 and $1,896, with the full measured move target at $1,697.
That $1,697 reading sits below the February 6 ETH cycle low of $1,744. A move there would mark a true cycle reset, fresh territory for the current leg.
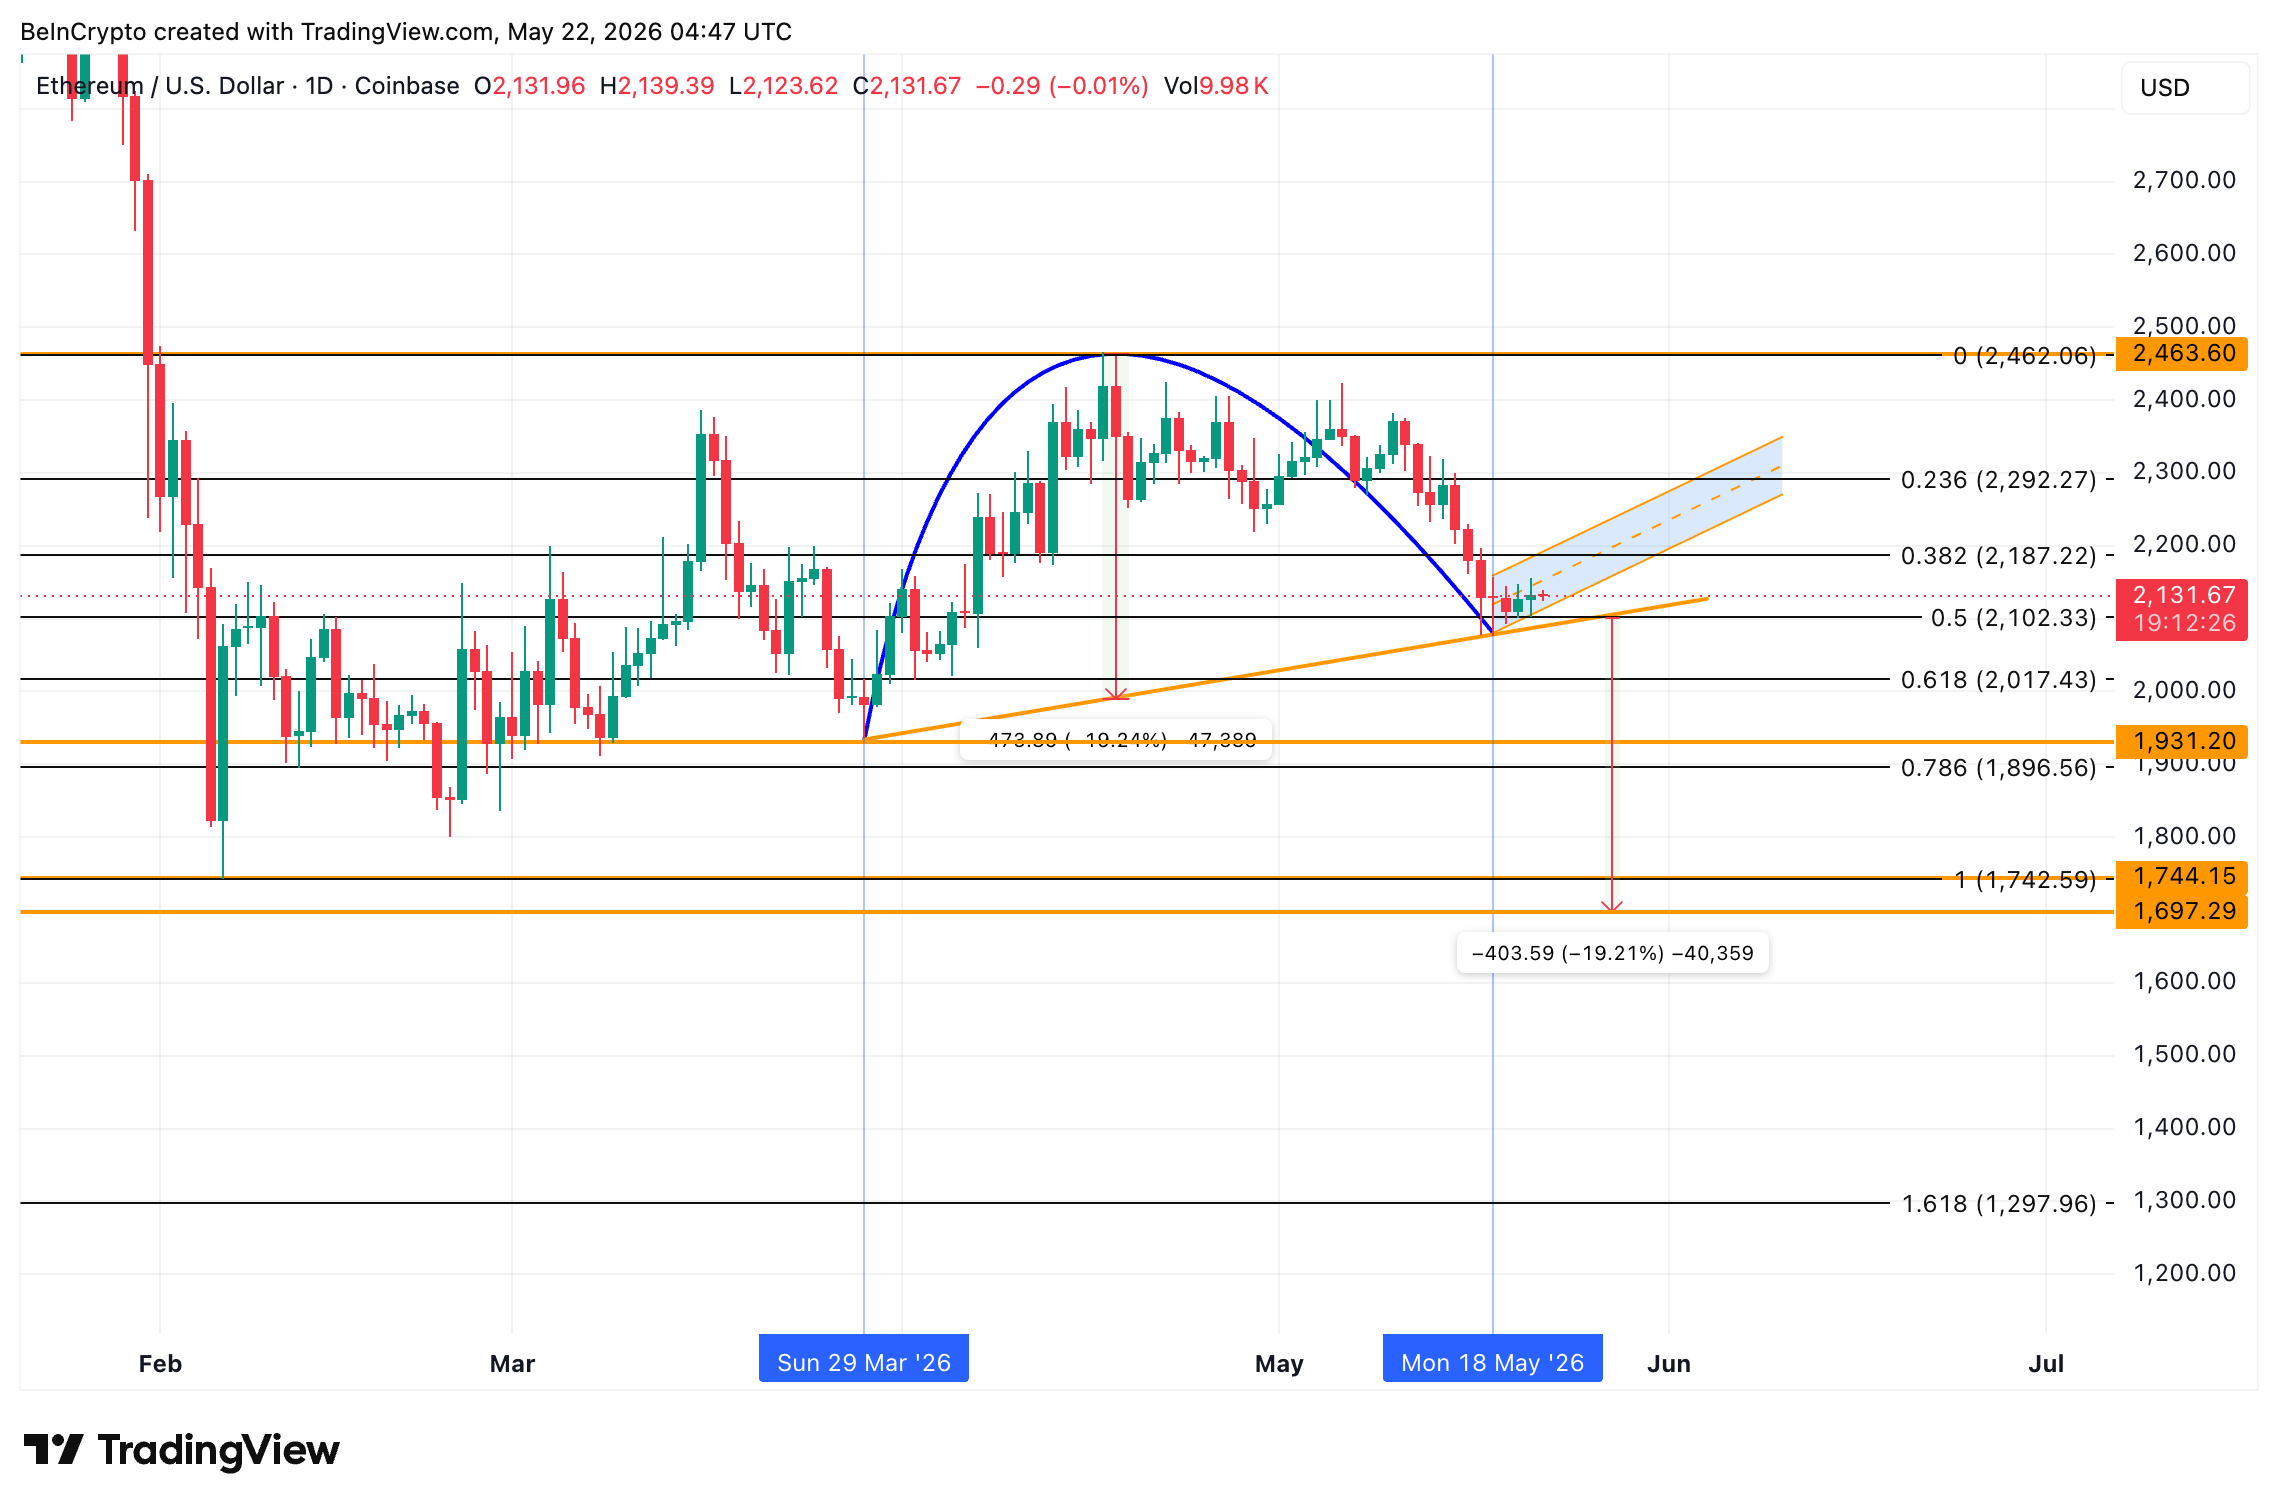
For the bullish thesis to gain traction, the Ethereum price needs to clear $2,292 first. A daily close above $2,462 would invalidate the inverted cup and handle. The $2,102 level separates a hodler defense holding the line from a full cycle reset to $1,697.
The post $725 Million in Ethereum (ETH) Just Left Whale Wallets: The Timing Is Suspicious appeared first on BeInCrypto.


$XRP price is holding its ground while the rest of the market buckles, as supported by its ETF flow data. The post XRP Price Defies
A bipartisan group of more than a dozen U.S. representatives has introduced legislation to enshrine a Strategic Bitcoin Reserve in federal law, mandate a minimum
Japan’s swift budget reversal highlights economic volatility, signaling potential shifts in fiscal policy and investor sentiment amid inflation. The post Japan’s extra budget expected to
Europe’s energy security is at risk, potentially leading to higher gas prices, demand destruction, and increased market volatility. The post Equinor warns Europe gas stocks