


BraveNewCoin data placed LINK at $9.19, up 1.34% over 24 hours, while the token traded between $8.93 and $9.29 during the session.
Notably, the short-term rebound comes as Crypto With Gopal flags a double bottom pattern on the weekly chart. The analyst said the structure could show fading selling pressure if LINK continues holding the same support region.
Chainlink’s daily data shows buyers returning after the token tested lower levels during the previous session. Marketdata placed LINK’s market cap at $6.69 billion, with 24-hour volume near $286.14 million and available supply at 727.10 million LINK.
The price remains far below its all-time high of $52.70, reached on May 10, 2021. LINK is still down 82.55% from that peak, which keeps the broader recovery incomplete.
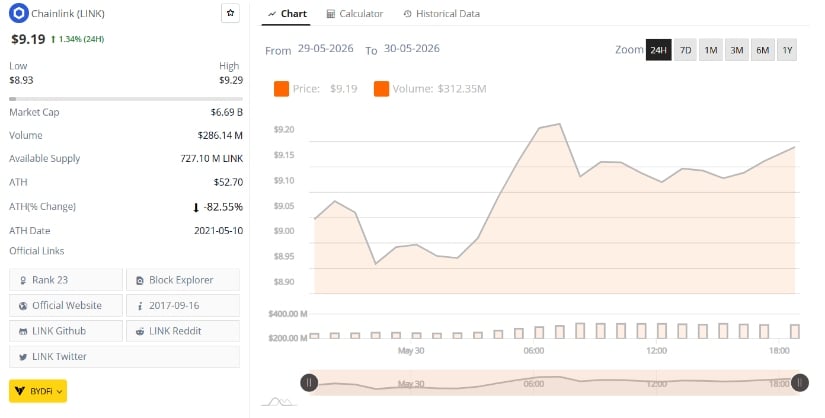
However, the current chart shows a steadier tone compared with the sharp weakness seen earlier in the week. Price moved from the $8.93 low toward the $9.20 area, suggesting that buyers defended the lower end of the 24-hour range.
Crypto With Gopal said Chainlink is developing a double bottom on the weekly timeframe. The chart shows two major lows forming near a similar support zone, which often signals that sellers are losing control after a long decline.
A double bottom becomes more important when the price breaks above the neckline near the previous major swing high. In LINK’s case, the analyst’s chart shows a wide recovery structure, with the potential breakout zone sitting far above the current price.
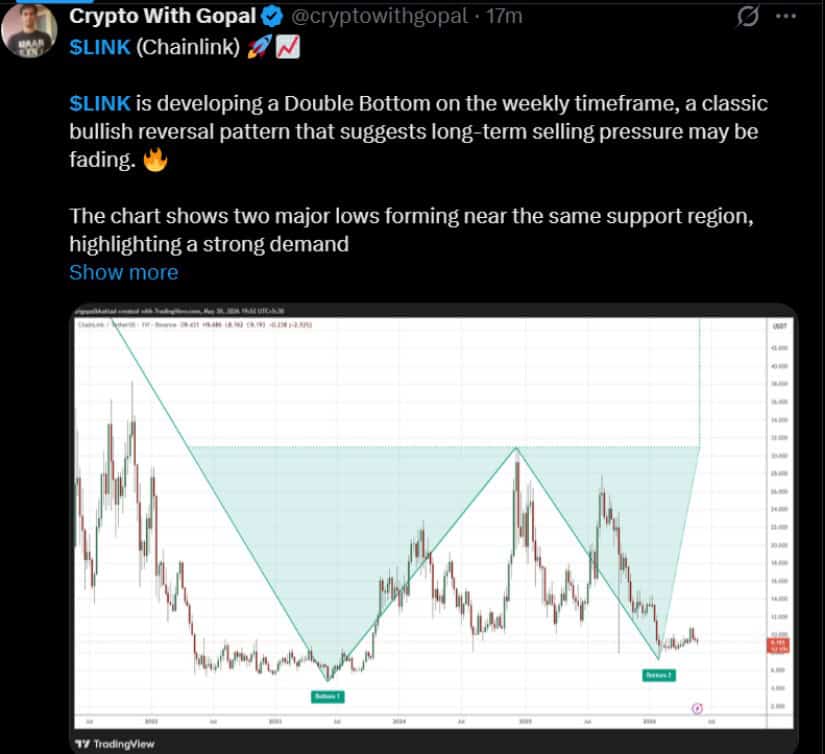
Nevertheless, the pattern on the X chart remains in development. LINK must continue holding the support region before traders can treat the setup as confirmed. A failure below the second bottom would weaken the bullish structure and return attention to lower support levels.
The analyst also said repeated support holds may show accumulation. That means buyers are stepping in around the same area instead of allowing a deeper breakdown.
TradingView’s 30-minute LINK/USDT chart showed the token near $9.209 at the time of writing. The price traded close to the middle Bollinger Band at $9.169, while the upper band stood near $9.226 and the lower band near $9.112.
This setup shows a narrow trading range after LINK recovered from a sharp dip below $8.90 on May 28. The rebound pushed the price back above the mid-band, but the token still faced resistance near the upper Bollinger Band.
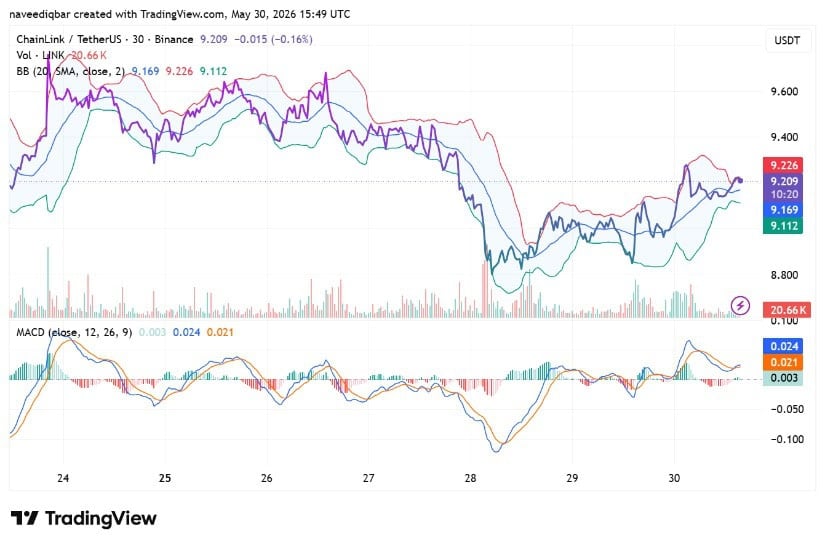
Meanwhile, the MACD TradingView chart showed a mild positive reading. The MACD line stood at 0.024, above the signal line at 0.021, while the histogram was near 0.003. That points to weak but improving short-term momentum.
Chainlink’s next move depends on whether buyers can keep the price above the $9.11 to $9.16 area. A clean move above $9.29 would strengthen the recovery attempt, while a drop below $8.93 would put the weekly double bottom support back under pressure.






According to Normative Instruction No. 739, issued on Friday, VASPs will now need to undergo an audit by an approved third-party entity to obtain authorization
Bitcoin Falls Below $73K as US-Iran Tensions Hit ETF Flows The post Bitcoin News: BTC Price Drops Below $73,000 as US-Iran Tensions Trigger ETF Outflows
Trump ‘Never Let Crypto Down’ Vow Triggers $2K BTC Drop The post Trump Bullish “We Will Never Let Crypto Down” Commitment Sent Crypto Market Down
Grok AI predicts $5 to $8 on XRP by end of 2026, and Elon Musk’s AI is building that call on a foundation that looks
