

Solana price is trading near $82.51, up just 0.13% in the last 24 hours, but the broader technical picture still looks fragile. After failing to build a stronger recovery, SOL is once again drifting around a major support area, and several analysts now believe the market could be setting up for another test lower before any sustainable rebound begins.
One of the clearest short-term warnings came from Crypto Chiefs, who pointed out that Solana price is exposed back towards the support region, with the structure suggesting a move towards $73.50. That level stands out because it marks the lower boundary of the recent range and represents the area where buyers would need to step in aggressively to prevent a deeper breakdown.
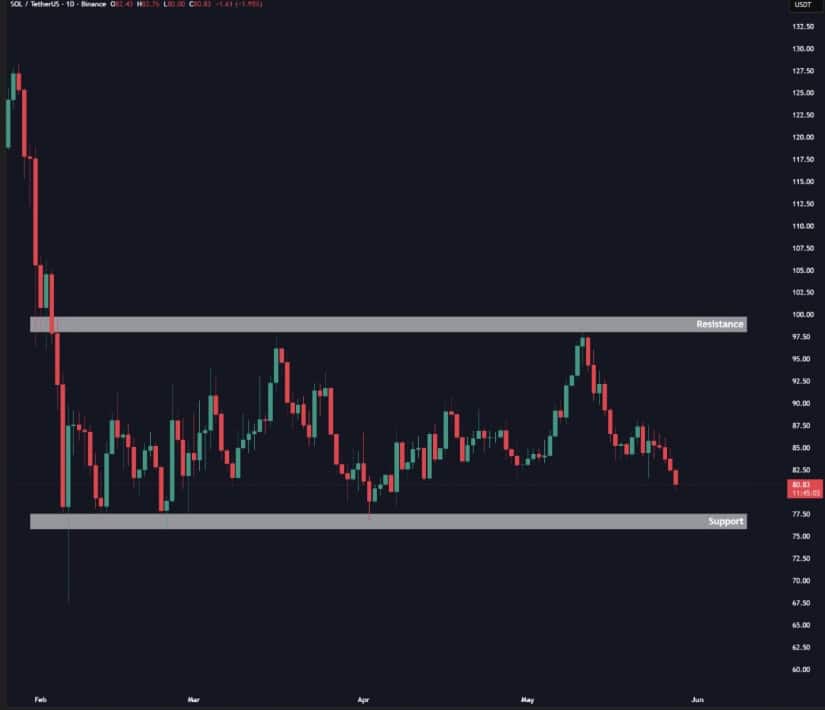 Solana slips back towards a critical support region that warns that SOL could face a deeper move towards $73.50. Source: Crypto Chiefs via X
The concern here is that Solana has already spent a lot of time trading weakly near support instead of rebounding sharply from it. When price keeps revisiting the same floor without a convincing bounce, it usually means demand is not strong enough to shift momentum. If SOL loses the lower range support cleanly, the move towards $73.50 becomes much more realistic rather than just a bearish possibility.
Umair Orakzai’s chart adds to the cautious tone. He noted that Solana has broken an important level, while also slipping out of its channel structure. On top of that, the point of control (POC) and the 100-day SMA were also broken, which weakens the idea that SOL is still maintaining strong bullish market structure.
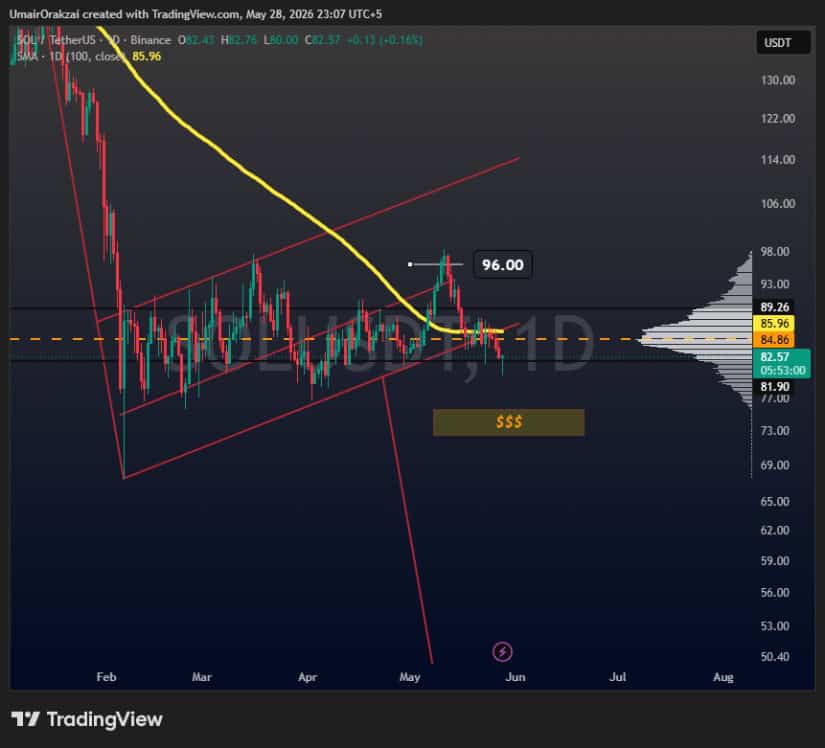 Solana breaks below its channel structure, POC, and 100-day SMA as technical pressure builds towards the $73.50 support zone. Source: Umair Orakzai via X
Even though Solana is still hovering above the $80 area, the loss of multiple technical supports in a short period is not something bulls can ignore. When price breaks a cluster of support markers at the same time, it often reflects weakening trend strength rather than simple short-term volatility. That is why the market is treating the current zone as unstable and could see a drop towards $73.50.
The liquidation heatmap adds another interesting layer to the setup. According CW8900, major liquidity clusters appear above the current price, especially in the $84 to $87 region, while lower pockets of interest also remain beneath price. This suggests that the next short-term move could be driven less by trend conviction and more by where the market can force liquidations.
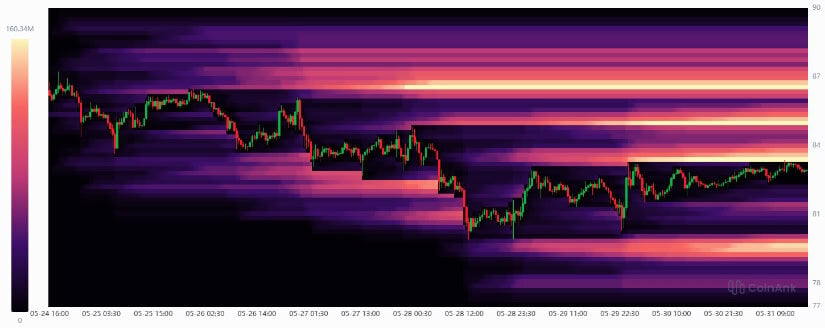 Solana’s liquidity map shows major overhead clusters around $84–$87. Source: CW8900 via X
That is why some traders think SOL could first squeeze upward into overhead liquidity before making a cleaner directional decision. A move into $84–$87 could trigger short liquidations and briefly support the price, but that alone would not automatically mean a bullish trend reversal.
SatoshiOwl offered a more tactical view, noting that he is currently long SOL but is also looking to take profits into strength. His point is important: weekend moves in crypto often happen in thinner liquidity conditions, which can produce a breakout towards $82-$84 that looks promising at first, but fades once stronger market participation returns.
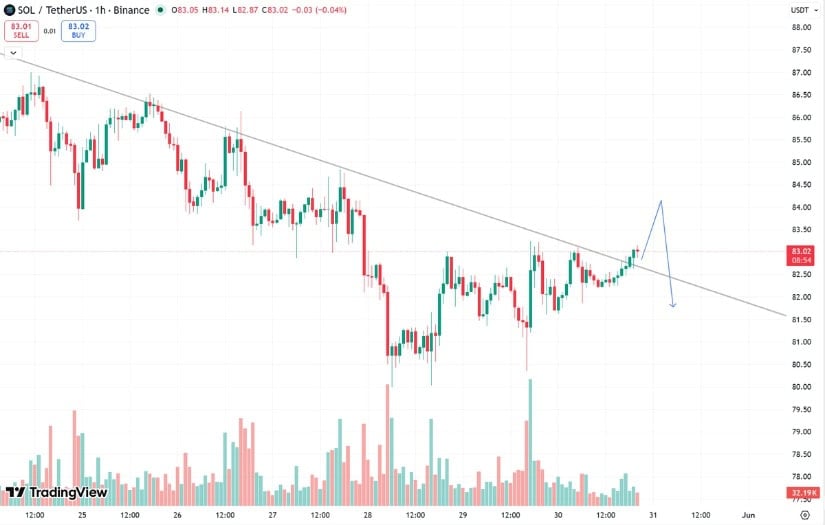 Solana’s weekend bounce could still be a trap, with any move towards $82–$84 needing stronger volume and clean follow-through to confirm recovery. Source: SatoshiOwl via X
This keeps the short-term outlook balanced. Solana could still break above a descending trendline and push slightly higher, but if that move lacks follow-through, it may end up trapping late longs rather than starting a real recovery. In other words, any bounce towards $84 would need confirmation through volume, sustained closes above resistance, and a clear improvement in structure.
Scient’s macro chart shows SOL still trading inside a wide long-term range rather than a confirmed breakout structure. The key support area sits near $82.38, which is where the price is currently reacting. As long as this zone holds, Solana can still attempt a recovery towards the mid-range near $116.75 and then the upper resistance band around $179.79.
However, the downside map is also clear. If SOL loses the $82–$80 region, the next major macro levels sit near $60.44 and $40.15. That is why this area matters so much: Solana is holding the lower part of a multi-year structure, but it has not yet shown enough strength to confirm a full reversal.
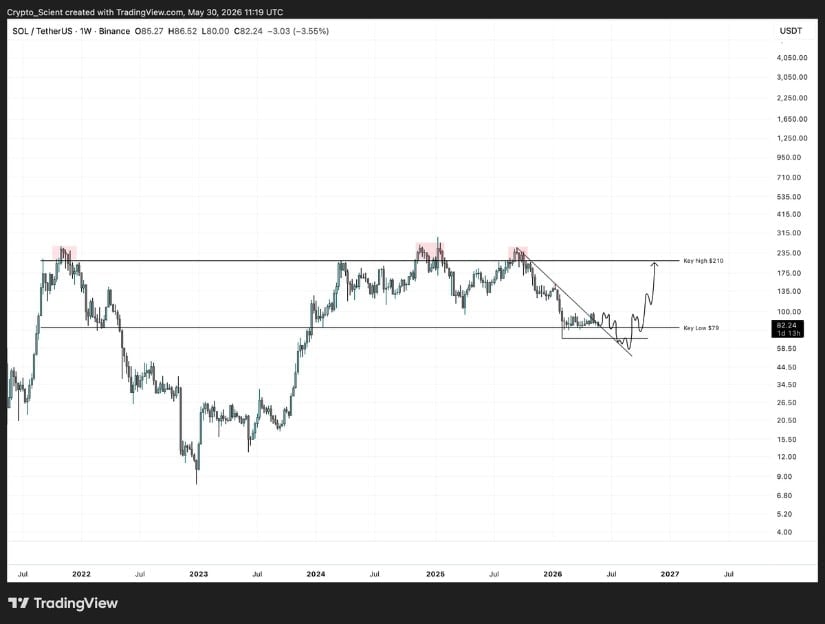 Solana remains in a wide decision zone, with $82–$80 acting as key support while $116.75 and $179.79 remain the next major upside levels. Source: Scient via X
The chart also shows a declining short-term trendline from the previous highs, meaning SOL still needs to break that diagonal pressure before bulls can regain control. Until then, the market remains in a decision zone, with support defending the downside and overhead resistance still limiting the recovery.
Solana’s short-term structure is now centered around a few clear levels that traders need to monitor closely.
Key support levels:
The $80 region is the first line of defense. As long as SOL remains above it, the market can still attempt to stabilize. But if that area starts to give way, the path towards $73.50 becomes clearer.
Key resistance levels:
For bulls, reclaiming the $84–$87 area would be the first step. A stronger recovery would need SOL to push back above $89–$90 and hold there. Without that, most upside moves may still be treated as temporary relief rather than real trend reversal.
Solana is at a delicate point. The current price near $82.51 keeps it above immediate support, but the broader structure still leans cautious. Multiple market watchers are warning that support is under pressure, key technical levels have been lost, and the market may still be vulnerable to a move towards $73.50.
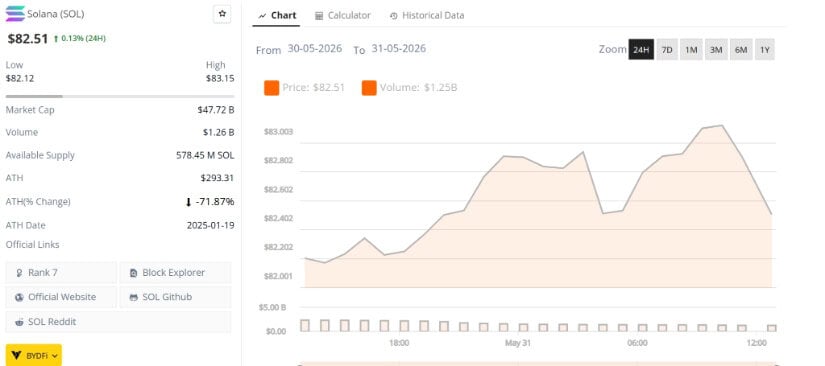 Solana price trades at $85.82, up 0.57% in the last 24 hours. Source: SOL price via Brave New Coin
At the same time, the setup is not fully one-sided. Liquidity above price could still fuel a short-term squeeze into the $84–$87 region, and short-lived weekend strength remains possible. But unless SOL starts reclaiming broken resistance with real momentum, those moves may end up being temporary.







