Bitcoin price started a fresh decline below the $72,500 zone. BTC is consolidating and might continue to move down if it dips below $70,500.
Bitcoin price failed to stay above the $74,000 support zone. BTC remained in a bearish zone and extended losses below the $73,500 level. There was a move below the $73,000 level.
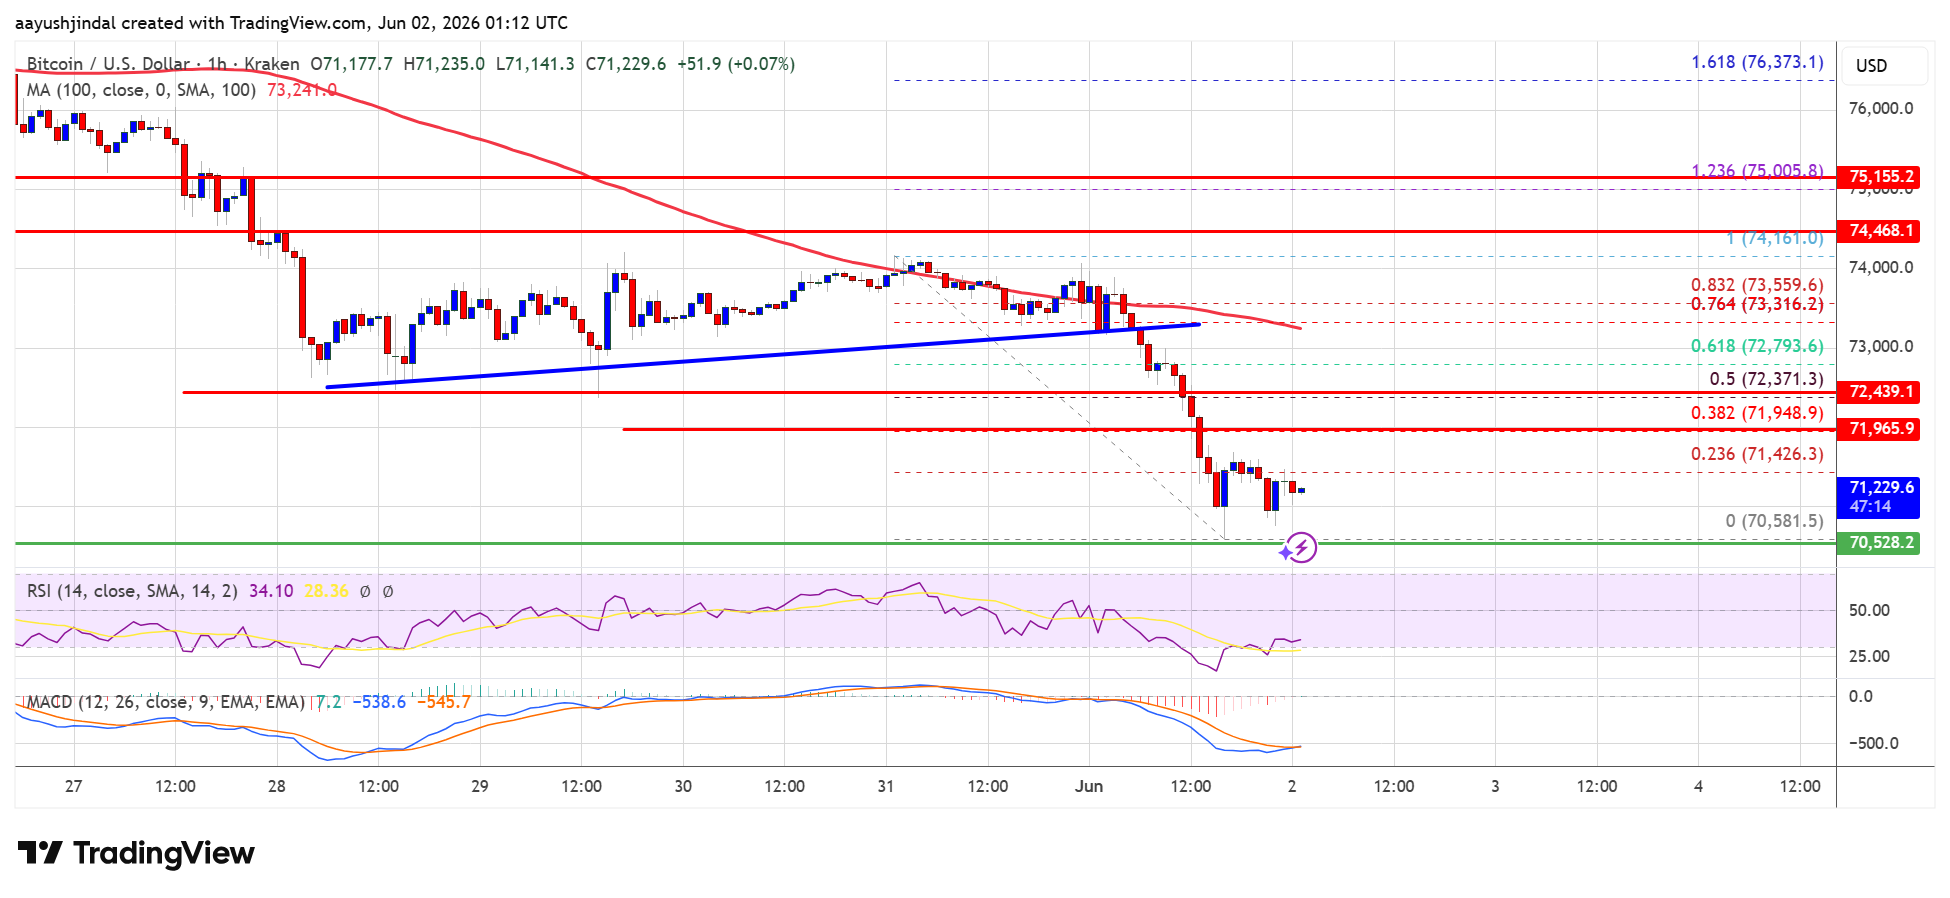
There was a break below a bullish trend line with support at $73,250 on the hourly chart of the BTC/USD pair. The price even dipped below $72,000. A low was formed at $70,581 and the price is now consolidating losses with a bearish angle below the 23.6% Fib retracement level of the downward move from the $74,161 swing high to the $70,581 low.
Bitcoin is now trading below $72,500 and the 100 hourly simple moving average. If the price remains stable above $70,000, it could attempt a fresh increase. Immediate resistance is near the $71,950 level. The first key resistance is near the $72,350 level and the 50% Fib retracement level of the downward move from the $74,161 swing high to the $70,581 low.
A close above the $72,350 resistance might send the price further higher. In the stated case, the price could rise and test the $73,500 resistance. Any more gains might send the price toward the $74,000 level. The next barrier for the bulls could be $75,000.
If Bitcoin fails to rise above the $72,500 resistance zone, it could start another decline. Immediate support is near the $71,200 level.
The first major support is near the $70,500 level. The next support is now near the $70,000 zone. Any more losses might send the price toward the $68,800 support in the near term. The main support now sits at $68,500, below which BTC might struggle to recover in the near term.
Technical indicators:
Hourly MACD – The MACD is now gaining pace in the bearish zone.
Hourly RSI (Relative Strength Index) – The RSI for BTC/USD is now below the 50 level.
Major Support Levels – $70,500, followed by $70,000.
Major Resistance Levels – $71,950 and $72,350.


Justin Bons, the CIO of Cyber Capital—described as Europe’s oldest crypto investment fund—used X (previously Twitter) on Monday to deliver a pointed critique of Ethereum
The proposal, introduced by pseudonymous developer cavemanloverboy, aims to increase the amount of SOL burned by introducing a new base fee for every transaction. This
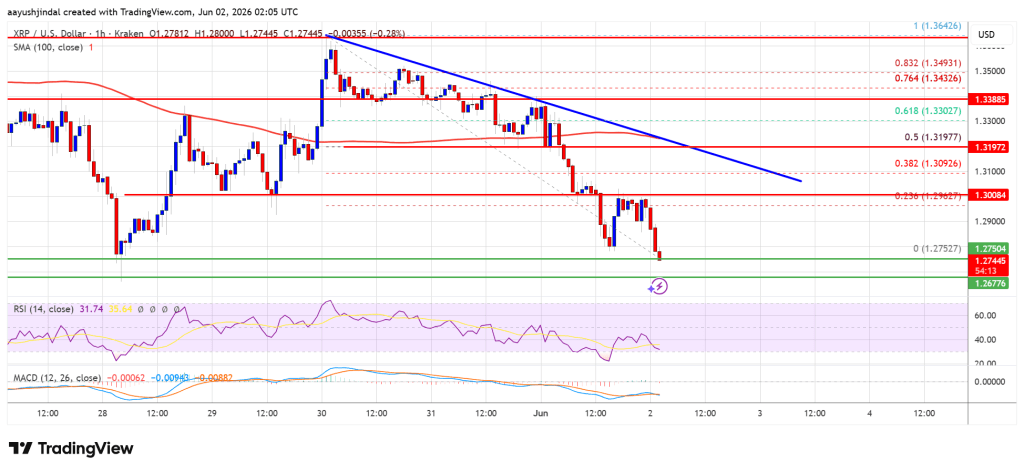
XRP price extended losses and traded below $1.320. The price is now consolidating losses and faces hurdles near $1.2880 and $1.30. XRP price started another
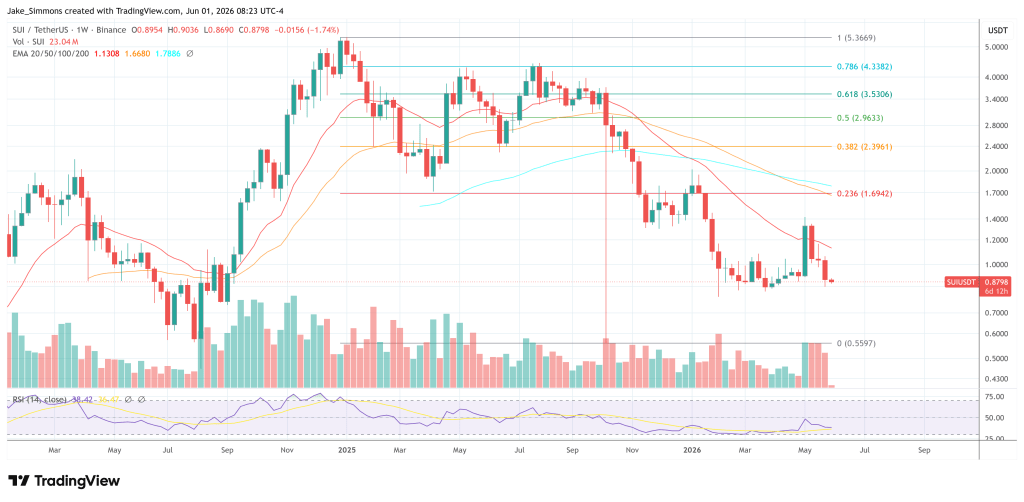
Sui’s mainnet suffered three separate outages across May 28 and May 29 after the network’s 1.72 release exposed edge cases in gas charging and validator