
Gold is approaching a major support test after an extended decline pushed XAU/USD toward the low-$4,300 region.
Meanwhile, the market has not yet confirmed a durable recovery. Gold must first recover $4,350, then overcome higher resistance near $4,515 before the broader structure begins to improve.
Kamile Uray’s four-hour chart shows gold continuing lower inside a developing harmonic structure. Price remains beneath the $4,515 swing high, which the analyst identified as the upper level controlling the current decline.
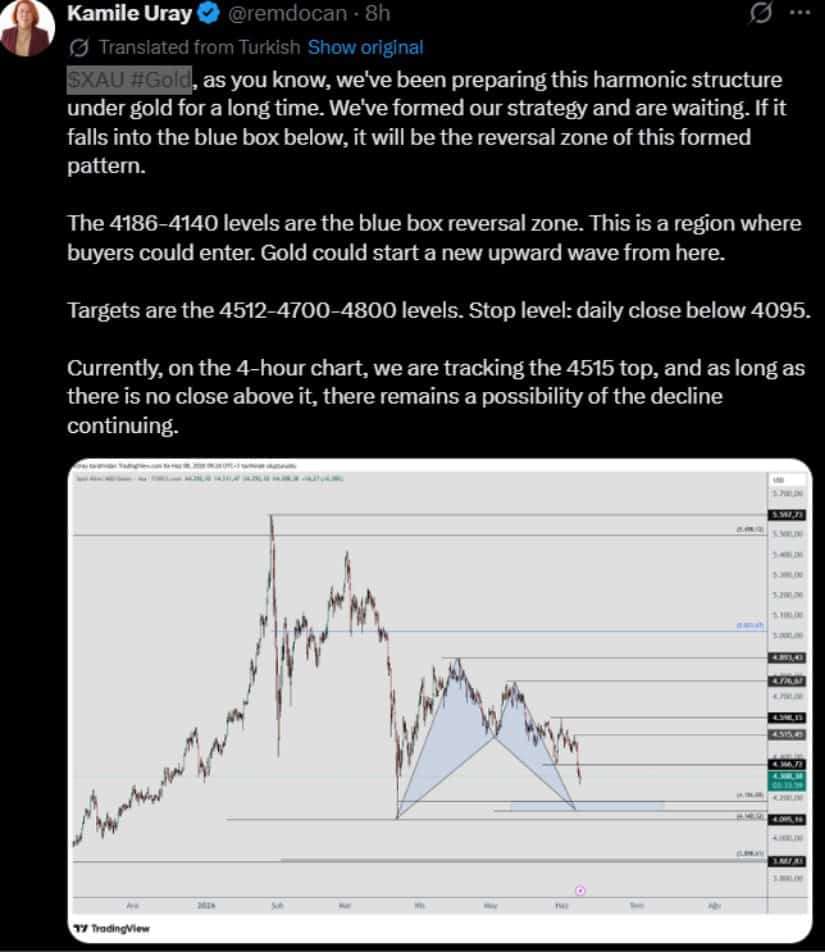
The X chart places a broader reversal zone between $4,186 and $4,140. That blue support area sits near the lower completion point of the harmonic setup and represents the region where buyers could begin responding.
Uray identified $4,512, $4,700, and $4,800 as possible upside targets if gold completes the pattern and reverses. However, those levels depend on price holding the lower support zone and producing a confirmed turn.
A daily close below $4,095 would invalidate that setup under the analyst’s plan. Gold has not reached that level, but its current direction keeps the lower support band in focus.
After breaking a few short-term supports, gold is trading within a descending channel as indicated in Always Win’s chart. In the last few days, Price has been trying to find a lower demand zone, but it’s still below the channel’s upper level.
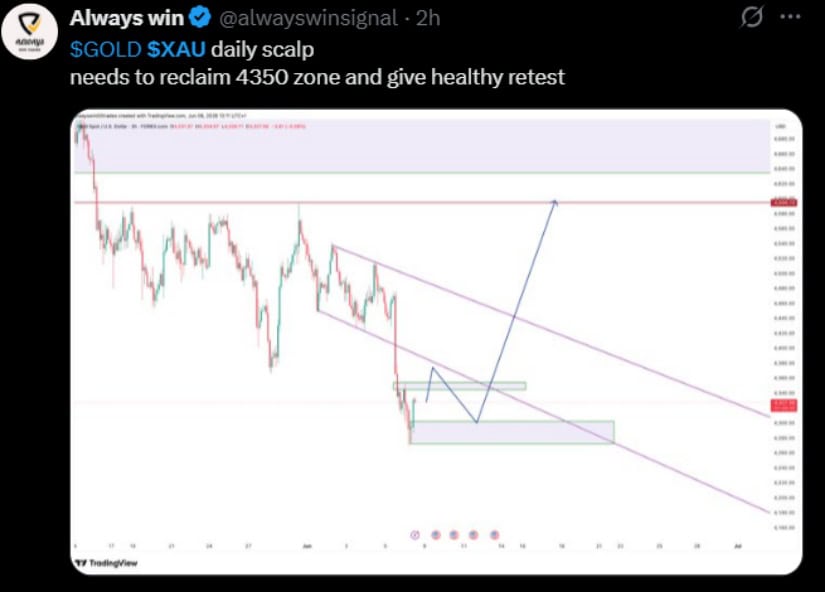
The analyst chart stated that gold must make a proper retest at $4,350. It would have to break above resistance, back up towards the level, and maintain it as support for that move to take place.
This would give better proof that the buyer is in control. For now, the chart is still trending lower as both highs and lows are lower.
The next level of resistance is located close to the bottom of the descending trendline at $4,350. Should the breakout occur, it would open the higher zone around $4500, and should the breakout be unsuccessful, it would force the lower demand areas to remain under pressure.
The previous trade saw the uptake of a 7.1% downward swing, indicating $4,200 as a level for a potential trend to go long, Swarmik said. The chart below demonstrates that prices have been declining rapidly from a range of consolidation before approaching the expected price base.
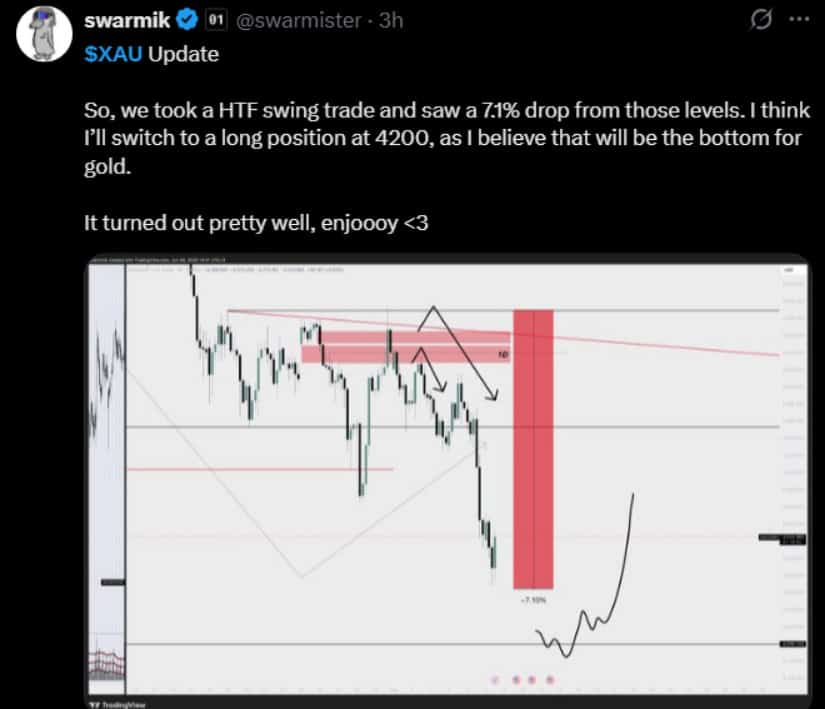
The overall harmonic reversal zone from Uray matches well with this one. The technical relevance of the region between $4,200 and $4,140 was added due to the overlap across the separate chart structures.
Nonetheless, both charts show an incomplete reversal. Gold is still below resistance close by and not in a compelling series of higher highs and higher lows.
The immediate map has three focus areas. Gold is poised for a difficult week as it approaches resistance around $4,515, with stronger resistance at $4,350 and support near $4,200. The $4,186-$4,140 zone is the next target for the harmonic price action.


Bitcoin (BTC) slipped below the $63,000 mark on Monday, extending a mild pullback as markets weighed a mix of regulatory developments, ETF flow data, and
Saudi Arabia’s price cut signals shifting power dynamics in global oil markets, highlighting Asia’s growing influence and demand uncertainties. The post Saudi Arabia slashes July
The escalation heightens geopolitical tensions, impacting global markets and investor sentiment, with potential long-term economic repercussions. The post Iran launches missile attack on Israel, rattling
Wealthy crypto investors are continuing to cluster around Bitcoin (BTC) and Ethereum (ETH), underscoring a defensive, ‘core-asset’ stance as market volatility persists. At the same