MicroStrategy stock (MSTR) is drawing bullish bets from short-term traders near $104, yet the biggest buyers are sitting it out, wagering the stock can still get cheaper. That split is the whole story.
Traders see a floor worth defending. Big investors see a stock chained to a falling Bitcoin, where a discount today can become a deeper one tomorrow.
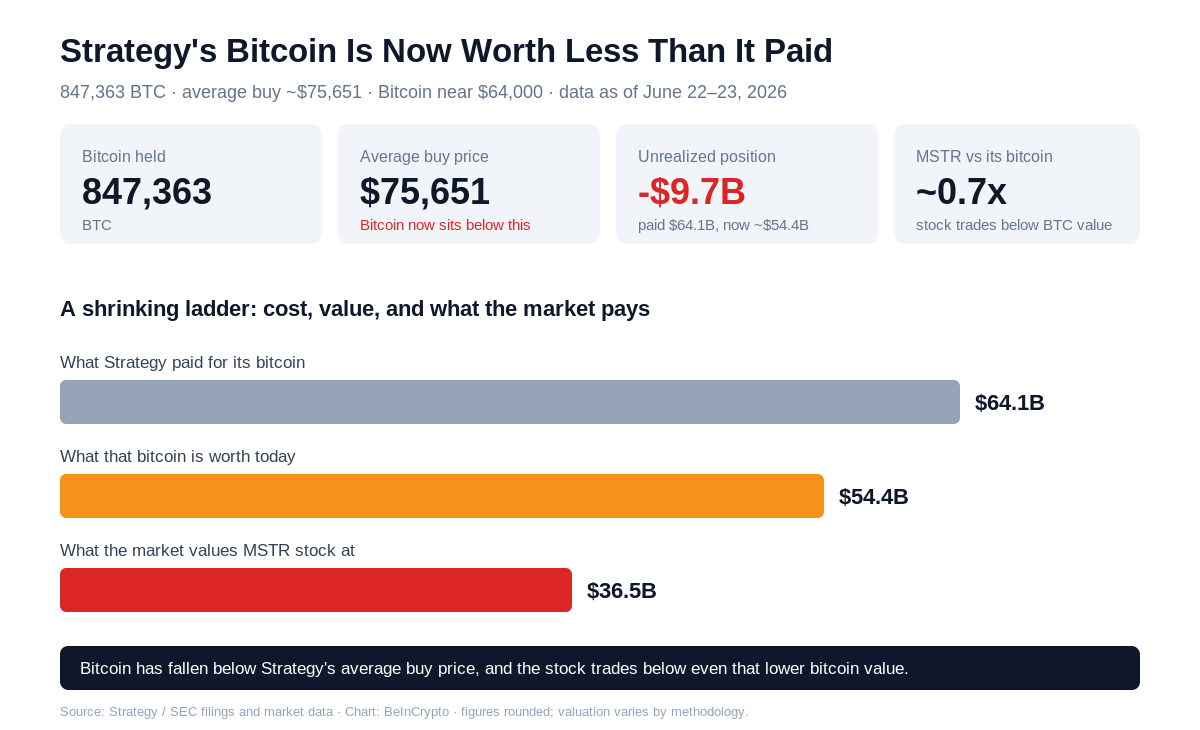
Strategy bitcoin holdings sit at 847,363 BTC bought for about $64.1 billion, an average near $75,651 per coin. With Bitcoin around $64,000, that stack is worth roughly $54.4 billion, leaving the company underwater by close to $10 billion.
Want more insights like this? Sign up for Editor Harsh Notariya’s Daily Newsletter here.
The stock itself is valued even lower. A company’s market value equals its share count times its share price, the total investors pay for the whole firm.
With about 351.6 million shares near $104, MicroStrategy is worth around $36.5 billion. That sits below the $54.4 billion of Bitcoin it holds, and well under the $64.1 billion it paid.
In plain terms, an investor could buy the entire company for less than the Bitcoin on its balance sheet.
This discount exists because MSTR stock runs on a simple loop. When the stock trades above the value of its Bitcoin, Strategy sells new shares at that premium and spends the cash on more Bitcoin.
Each raise leaves every existing share backed by more Bitcoin than before, so Bitcoin per share climbs and the price follows. Below the value of its Bitcoin, the loop reverses, because new shares now buy less Bitcoin than each share already holds.
So the big, repeatable raises that powered the stock have stopped. Strategy still adds small amounts of Bitcoin, and even sold a little this year to cover dividends, but the flywheel has slowed to a trickle.
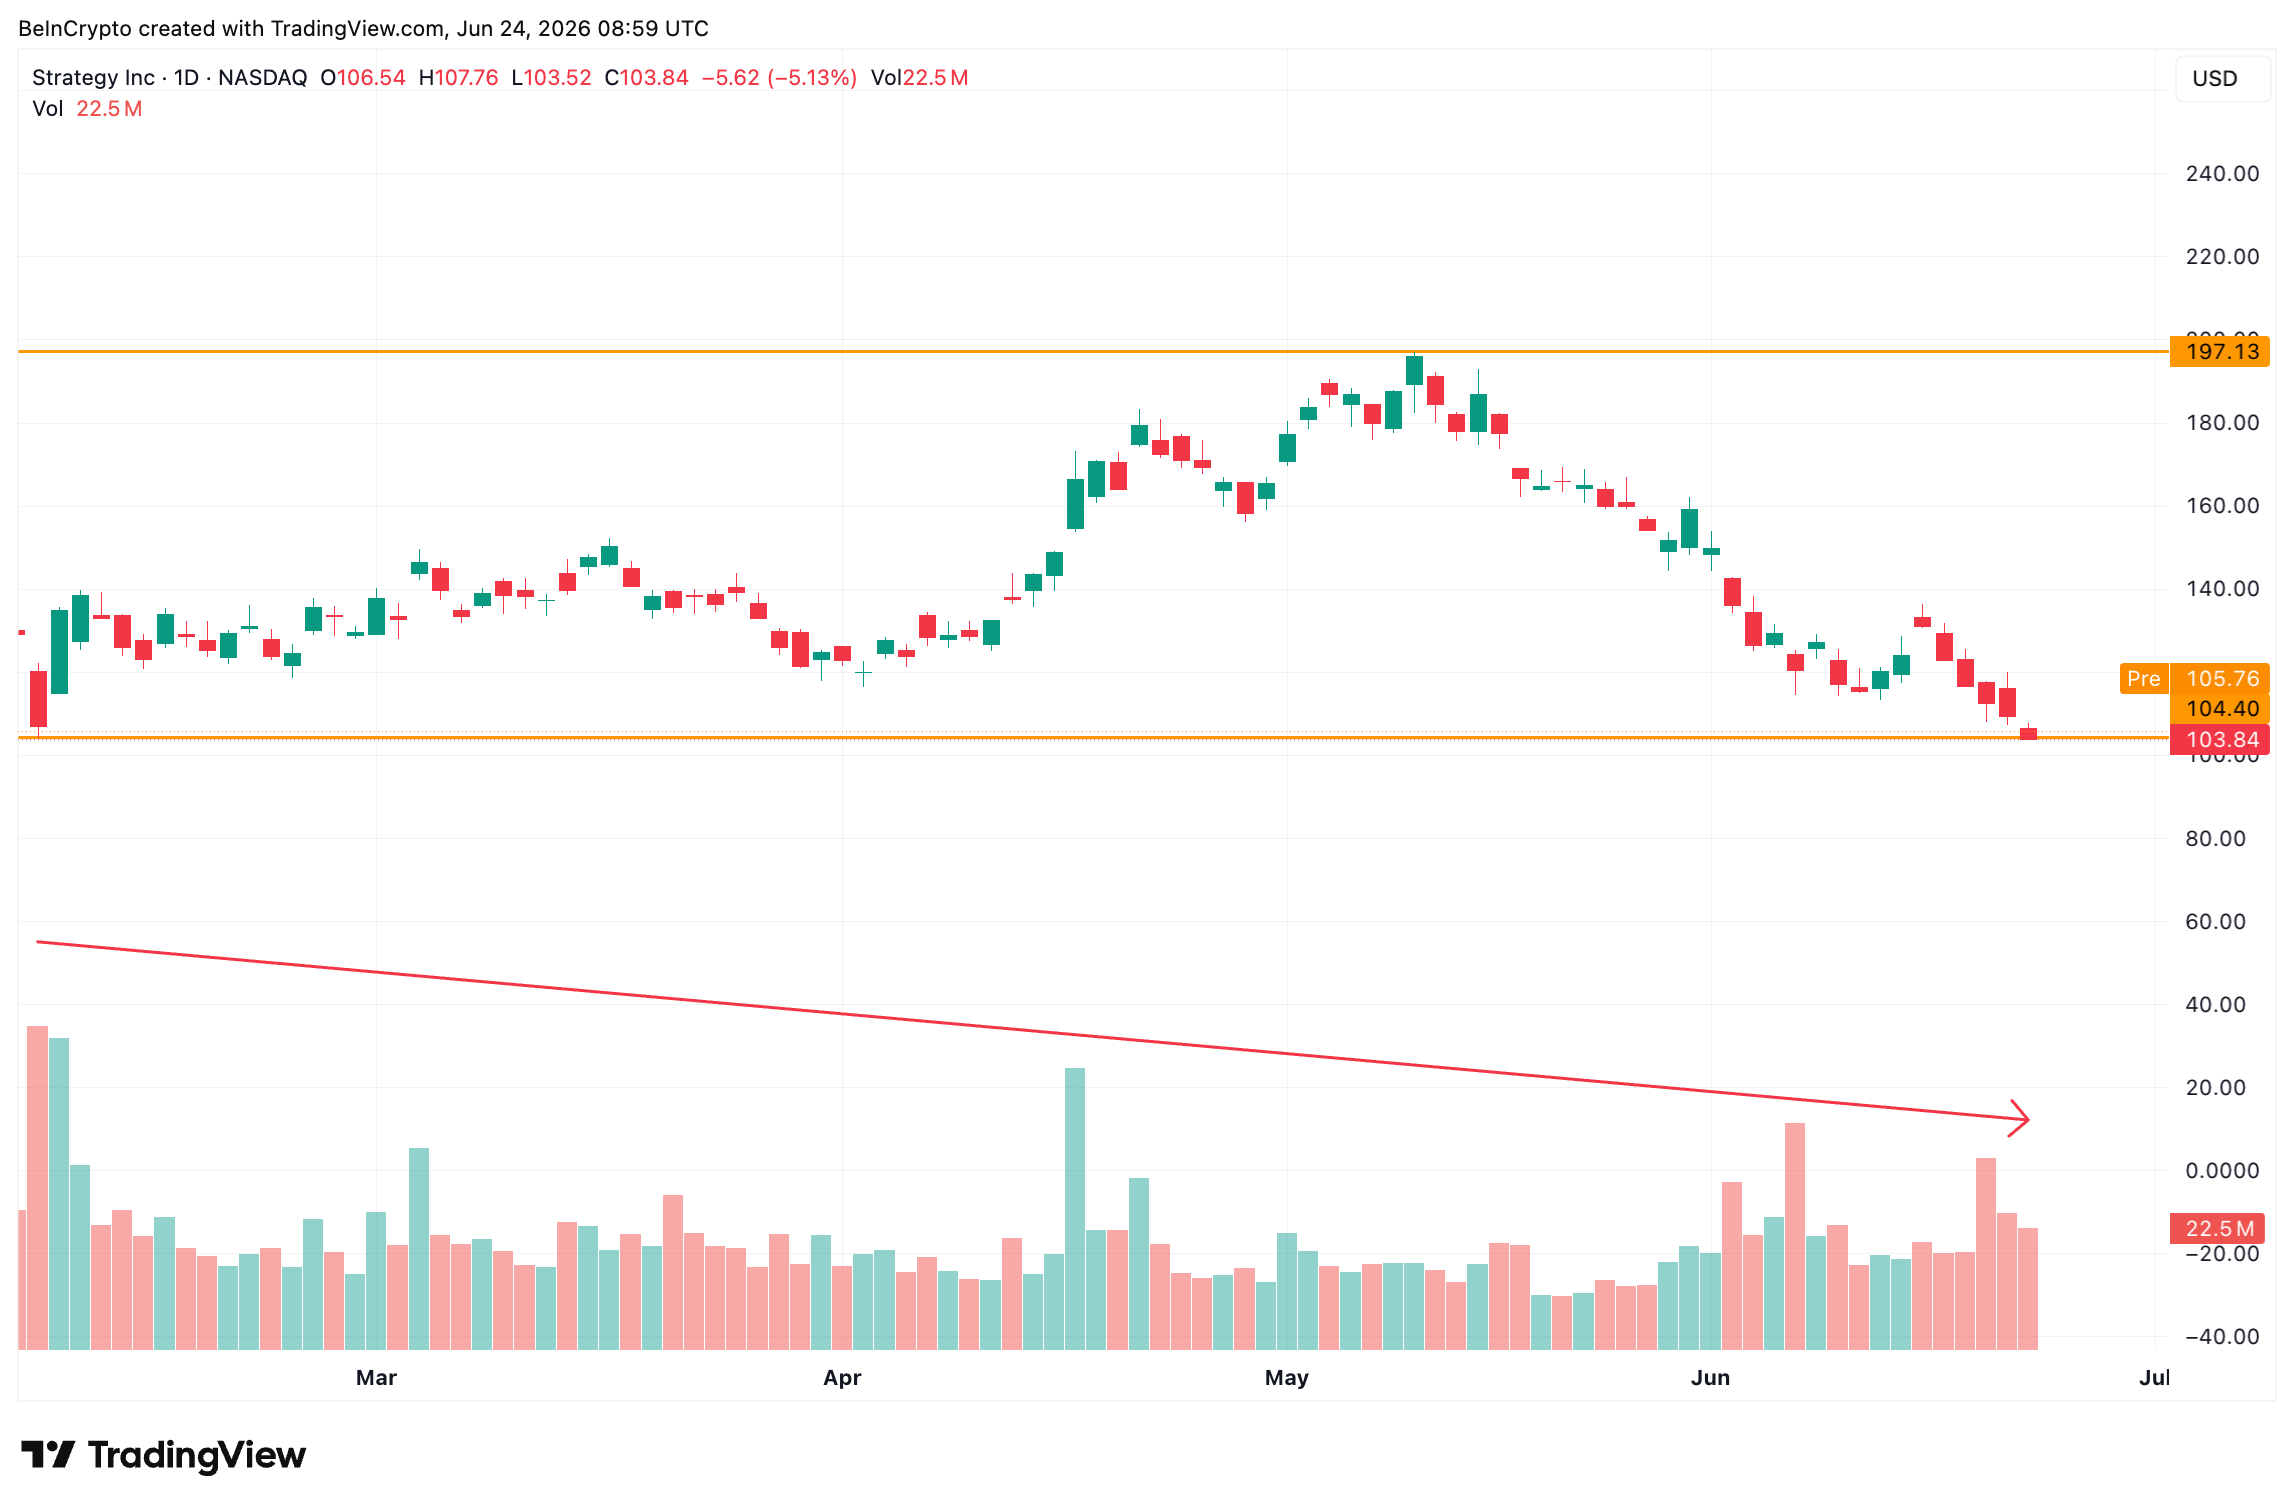
MSTR has possibly carved a double bottom, a pattern where price tests the same floor twice and holds, often before a bounce. The encouraging part is volume.
Selling volume between the two lows has dropped sharply. Lighter selling into a retest suggests sellers are running low, which can clear room for a rebound.
Money flow tells the opposite story. Chaikin Money Flow (CMF), a gauge of whether big institutional buyers or sellers control a stock, sits at -0.25 and keeps sliding, weaker than in early June when it still held above the zero line.
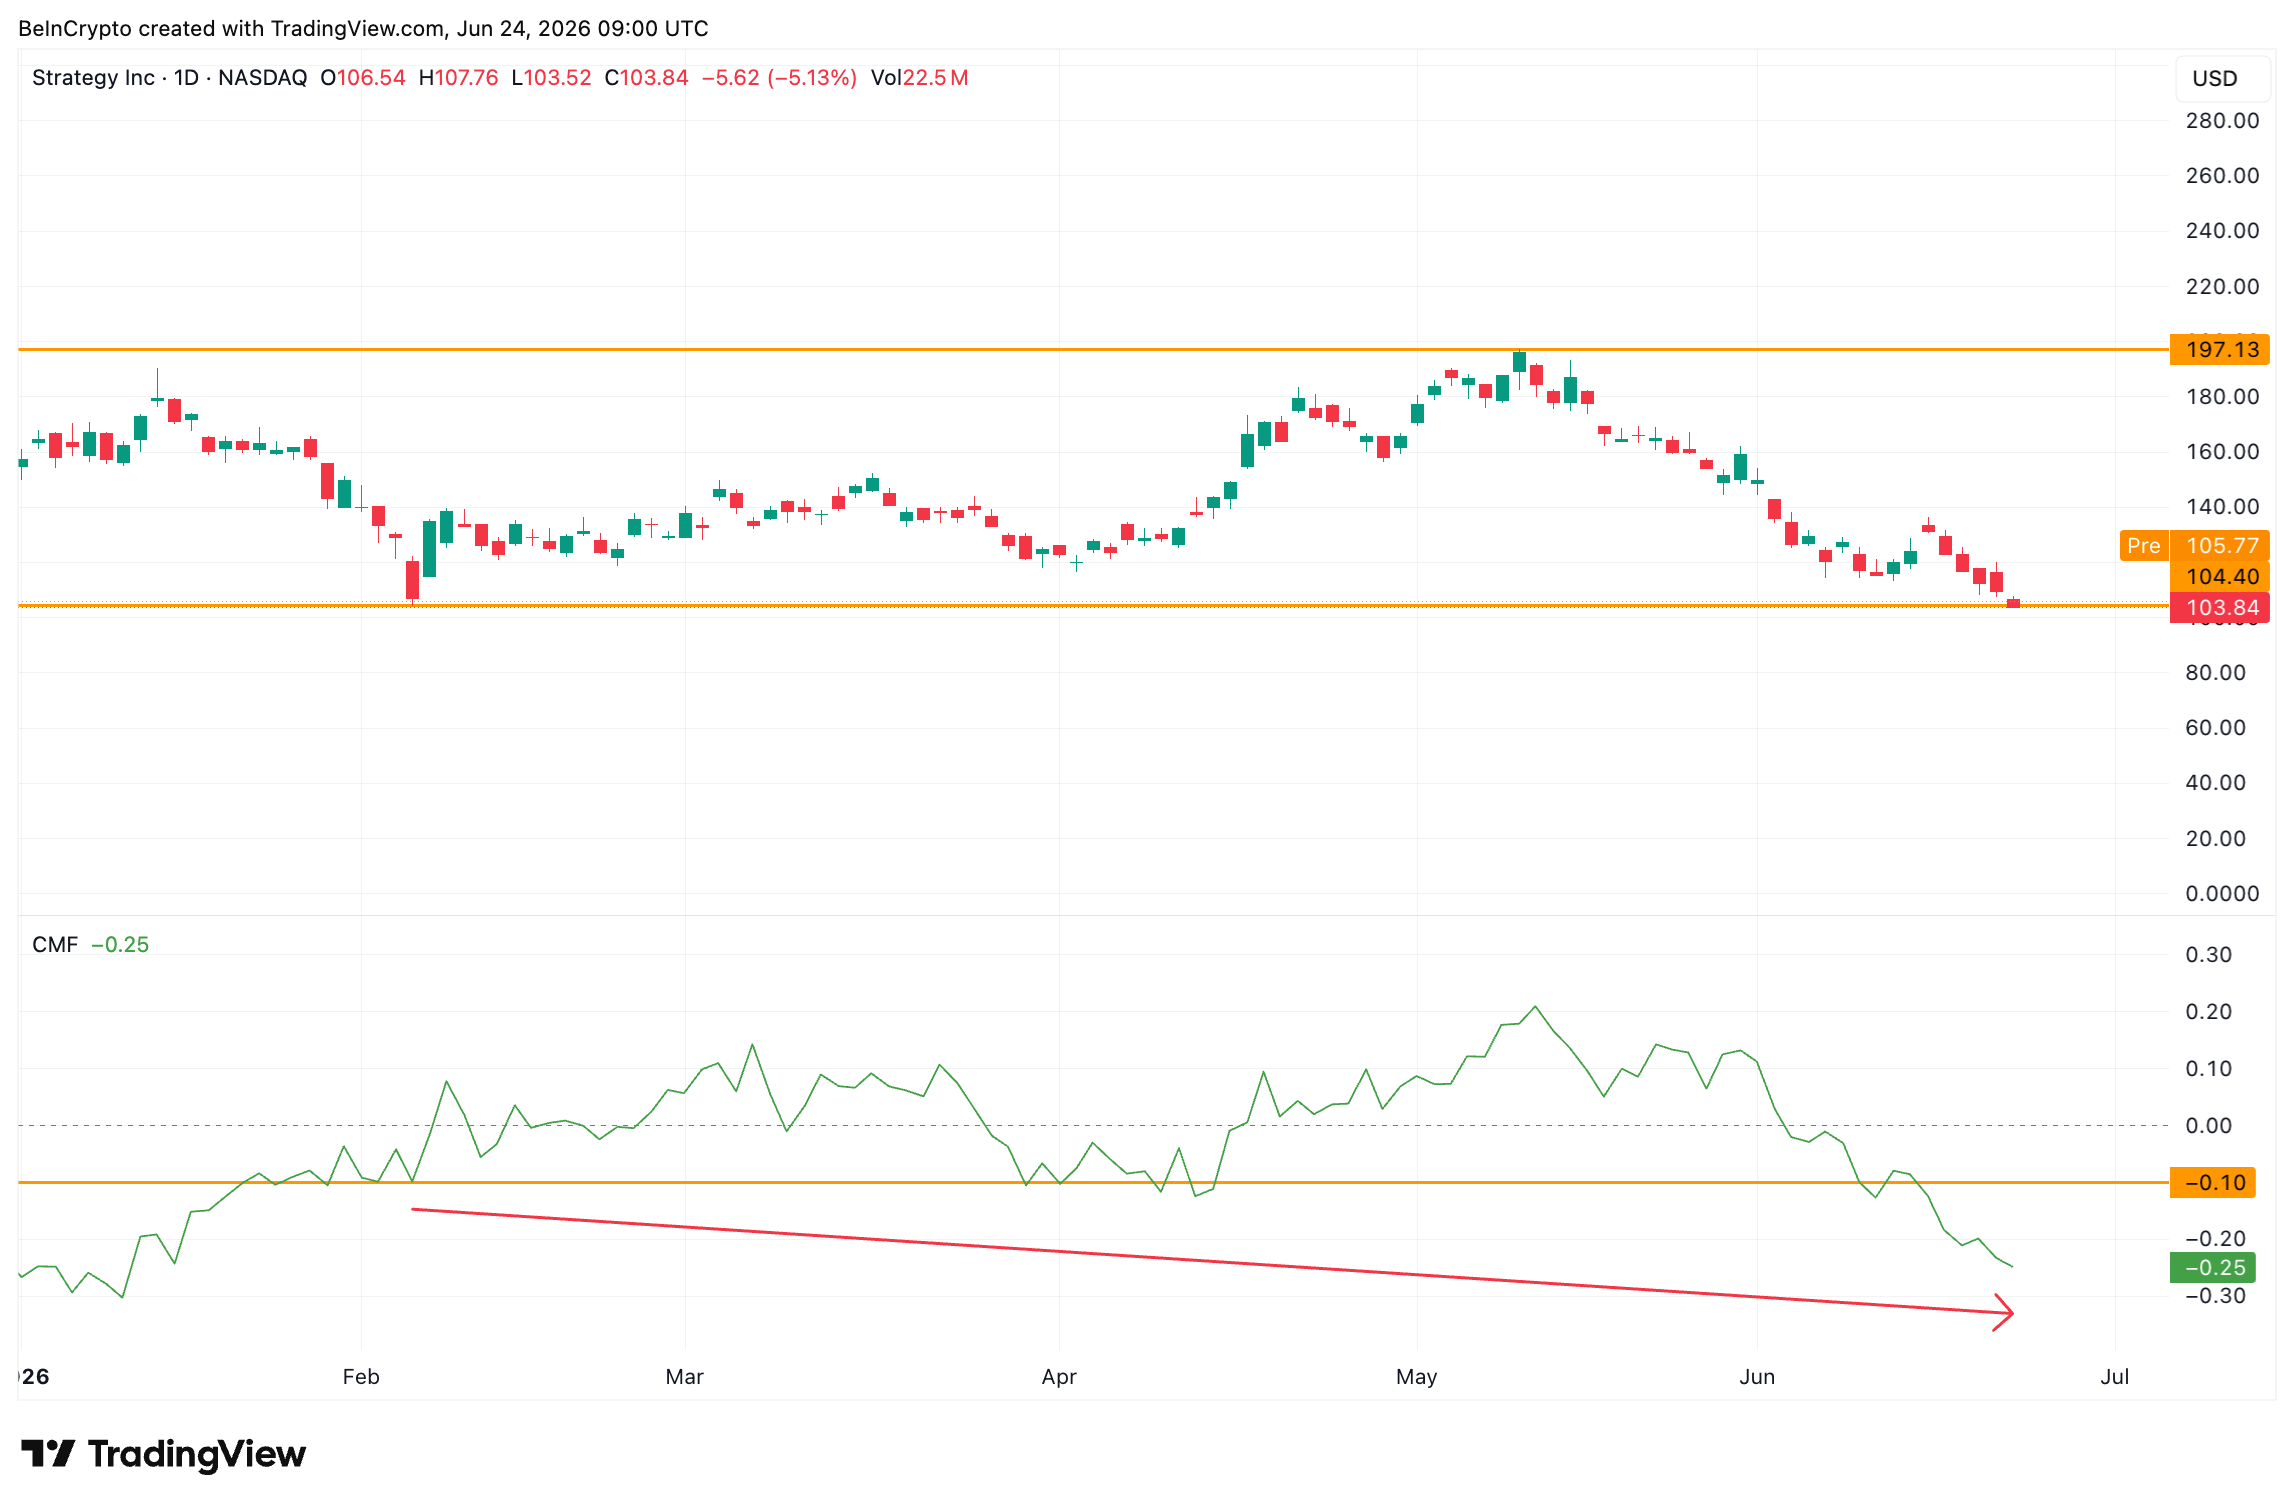
That is the contrast. The same chart that shows a double bottom in price shows steady outflows underneath it. Falling sell volume is not the same as fresh buying.
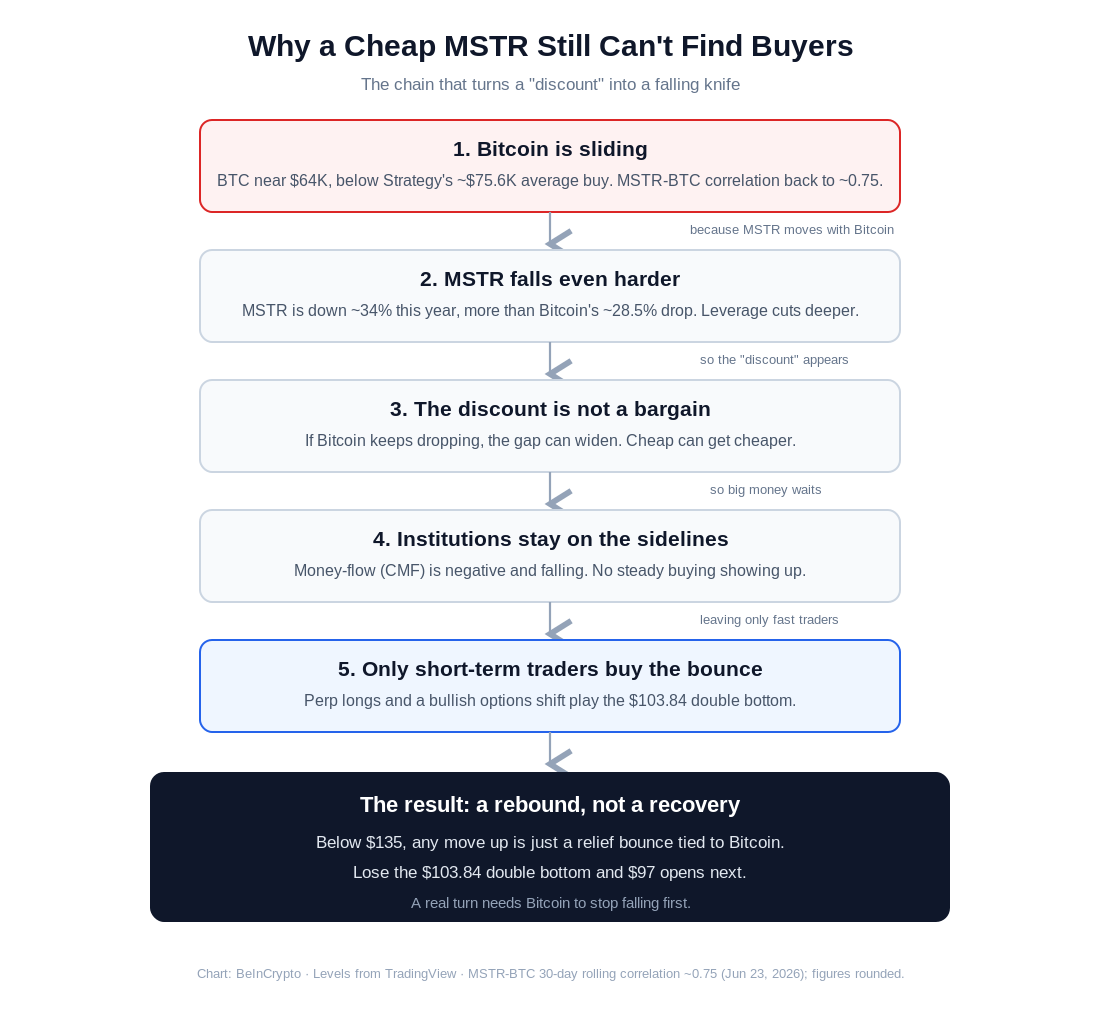
If big money is selling into a textbook bottom, the reason sits in MSTR’s tie to Bitcoin.
Bitcoin correlation explains the outflows. MSTR’s 30-day rolling correlation with Bitcoin sits near 0.75 as of June 23, up from about 0.40 in May, so the stock is gripping Bitcoin’s direction again.
Because MSTR moves with Bitcoin, the discount can widen if Bitcoin price keeps falling. Buying cheap means little when the asset behind the stock is still dropping.
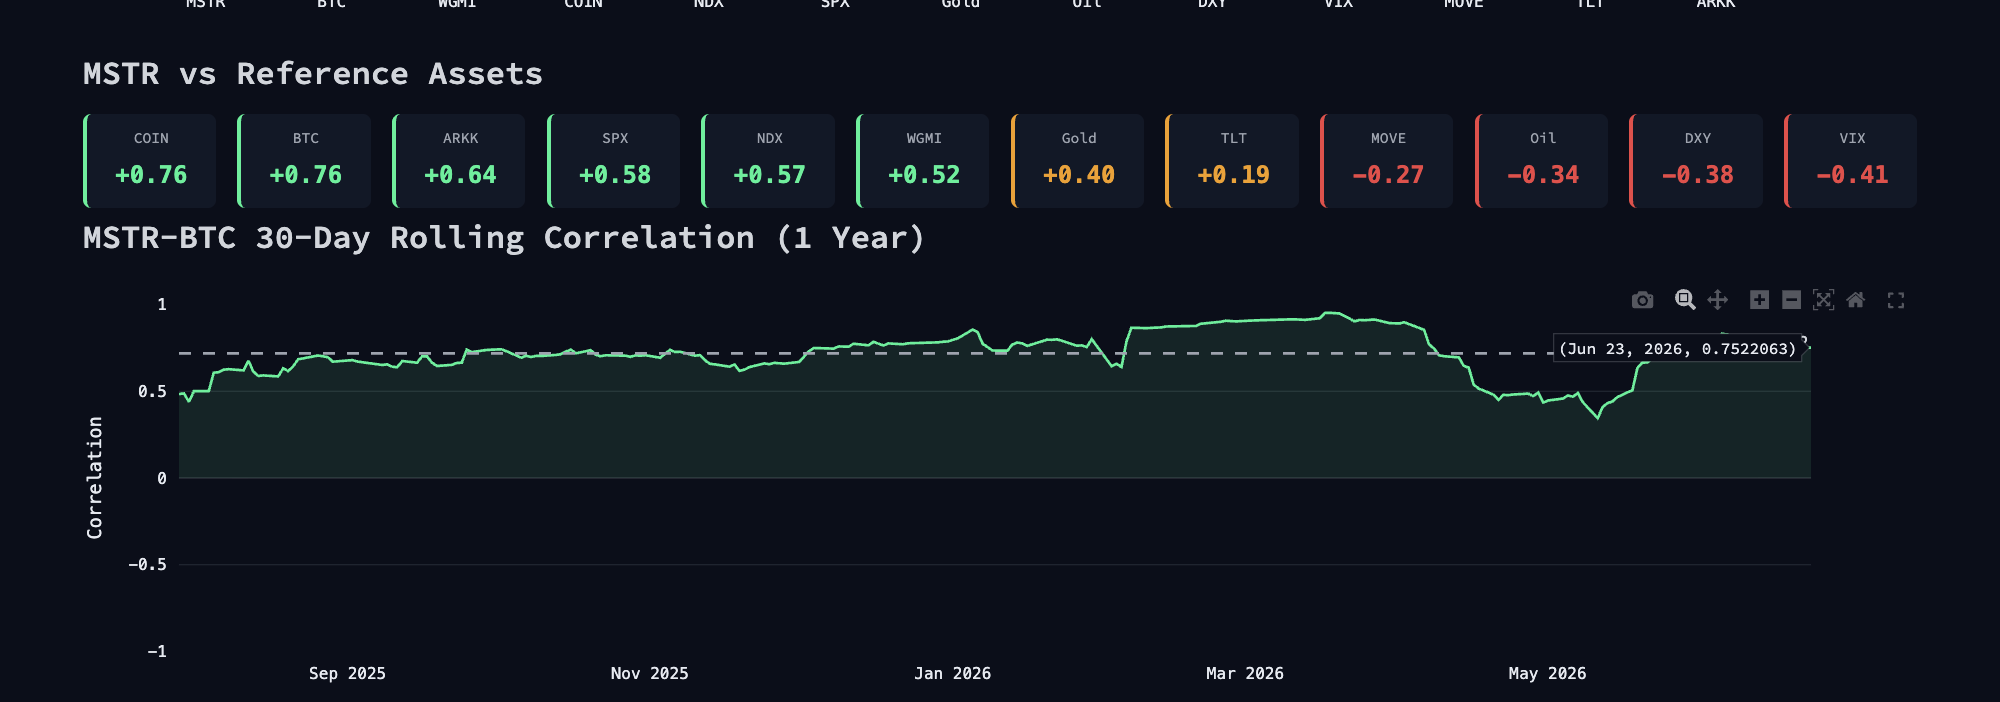
So large buyers appear to be waiting for Bitcoin to settle before they return, which keeps money flow negative.
With institutions on the sidelines, the bounce rests on faster hands.
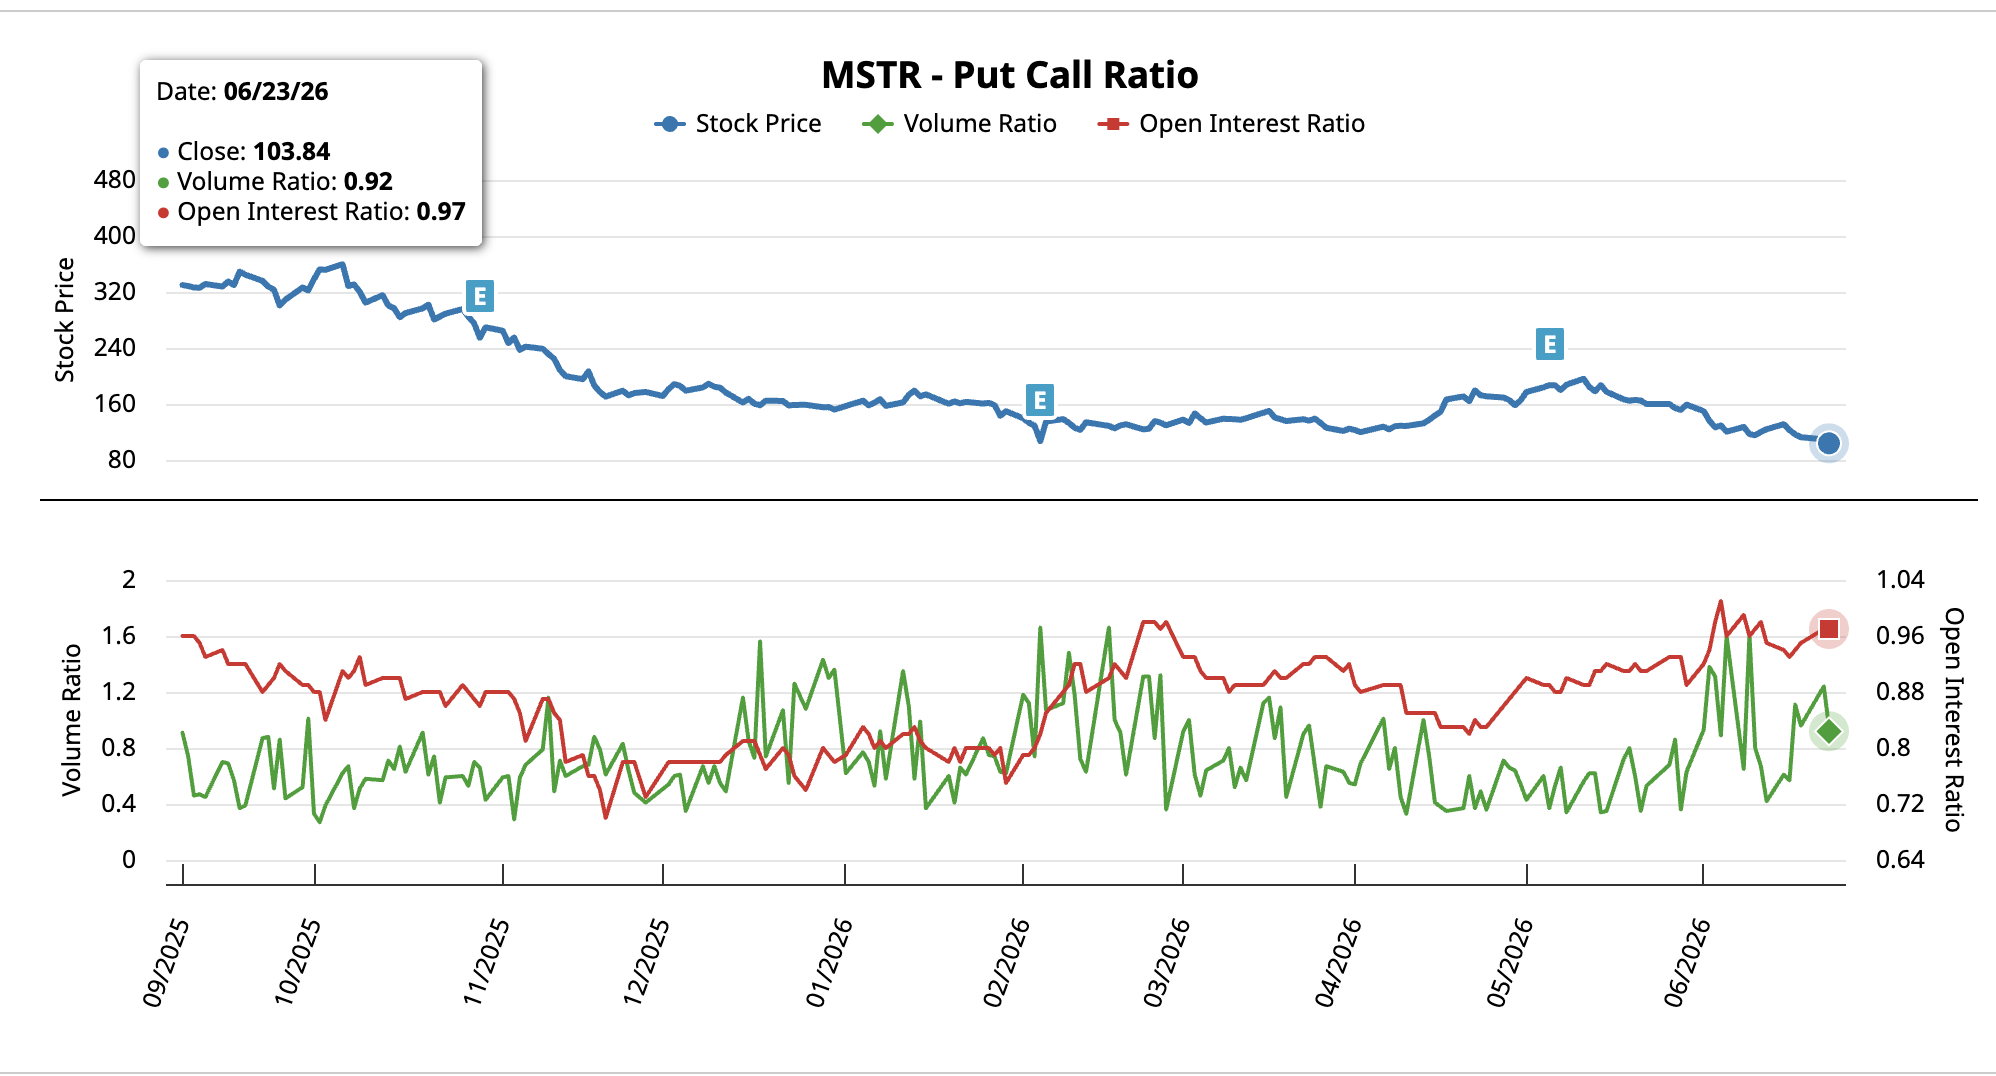
Options give the clearest read on how the market is positioning MicroStrategy stock, so the section starts there. The put-call ratio compares bearish put bets to bullish call bets.
The volume ratio, which tracks each day’s trading, fell from 1.11 on June 17 to 0.92 on June 23, flipping from put-heavy to call-heavy even as the stock dropped. The open interest ratio, the standing stack of contracts, barely moved and held near 0.97.
A falling stock usually drags both higher as traders pile into puts. Instead the daily flow turned bullish while open bets stayed call-heavy, so traders kept betting up into the decline.
On-chain data backs the bullish lean, but only just. This MSTR perpetual trades on Hyperliquid, a blockchain-based exchange, so every wallet’s position is recorded on-chain and open to view. Tracking platform Nansen reads that data and shows smart-money wallets net long the contract by about $297,000, and the figures suggest they added to that long over the past week.
The bet is small and lonely. Whale-tagged wallets sit flat, public-figure accounts lean net short by around $180,000, and the largest long is deep underwater while shorts sit in profit.
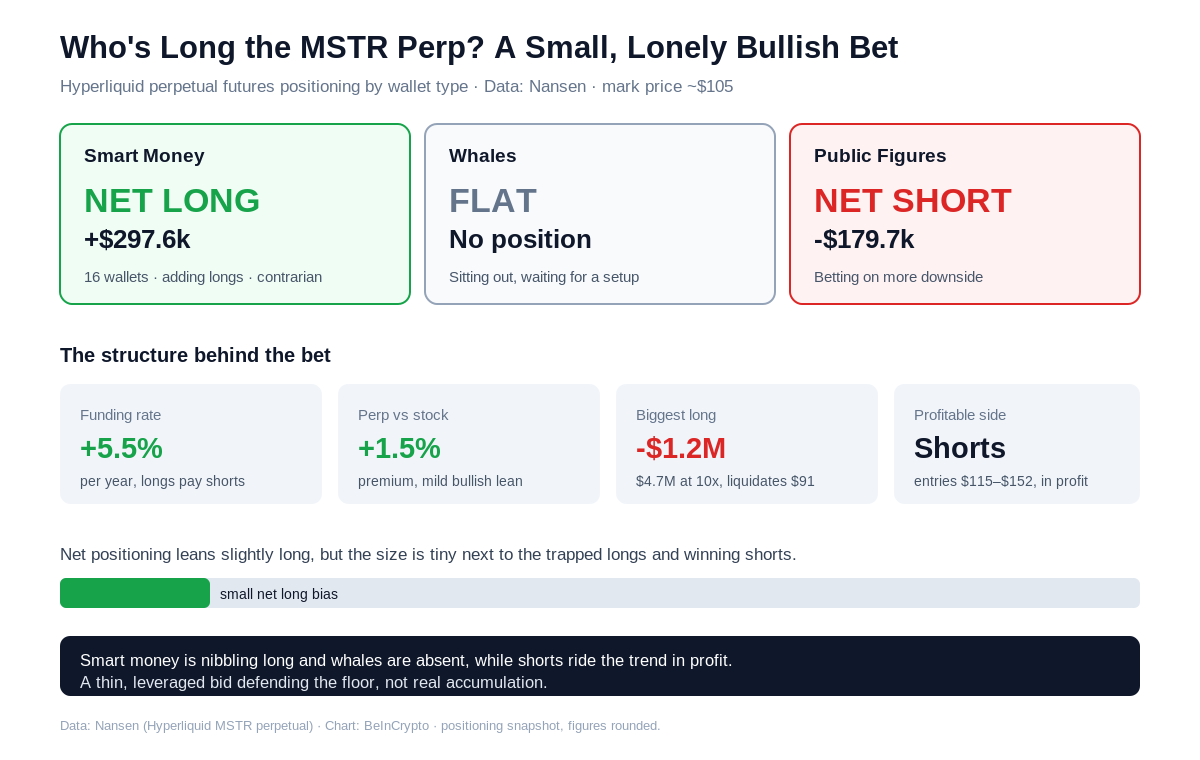
This is fast money, not patient money. It can defend a floor for a while, but it rarely holds without bigger buyers behind it. That leaves the price chart to settle the fight.
The MicroStrategy stock price levels start at the $103.84 double bottom (the $104 zone), the floor traders are defending. The first ceiling sits at $135.27, the 0.236 Fibonacci zone of the prior swing.
Below $135.27, any rally is a rebound rather than a true recovery, and it stays tied to Bitcoin’s next move. A clean break above it would be the first sign the trend is healing. But the “MSTR Stock gets cheaper” narrative still holds.
The downside is just as clear. Losing $103.84 cleanly opens $97.13, the 0.382 Fibonacci level and the first real test. A break there exposes deeper support near $66.31.
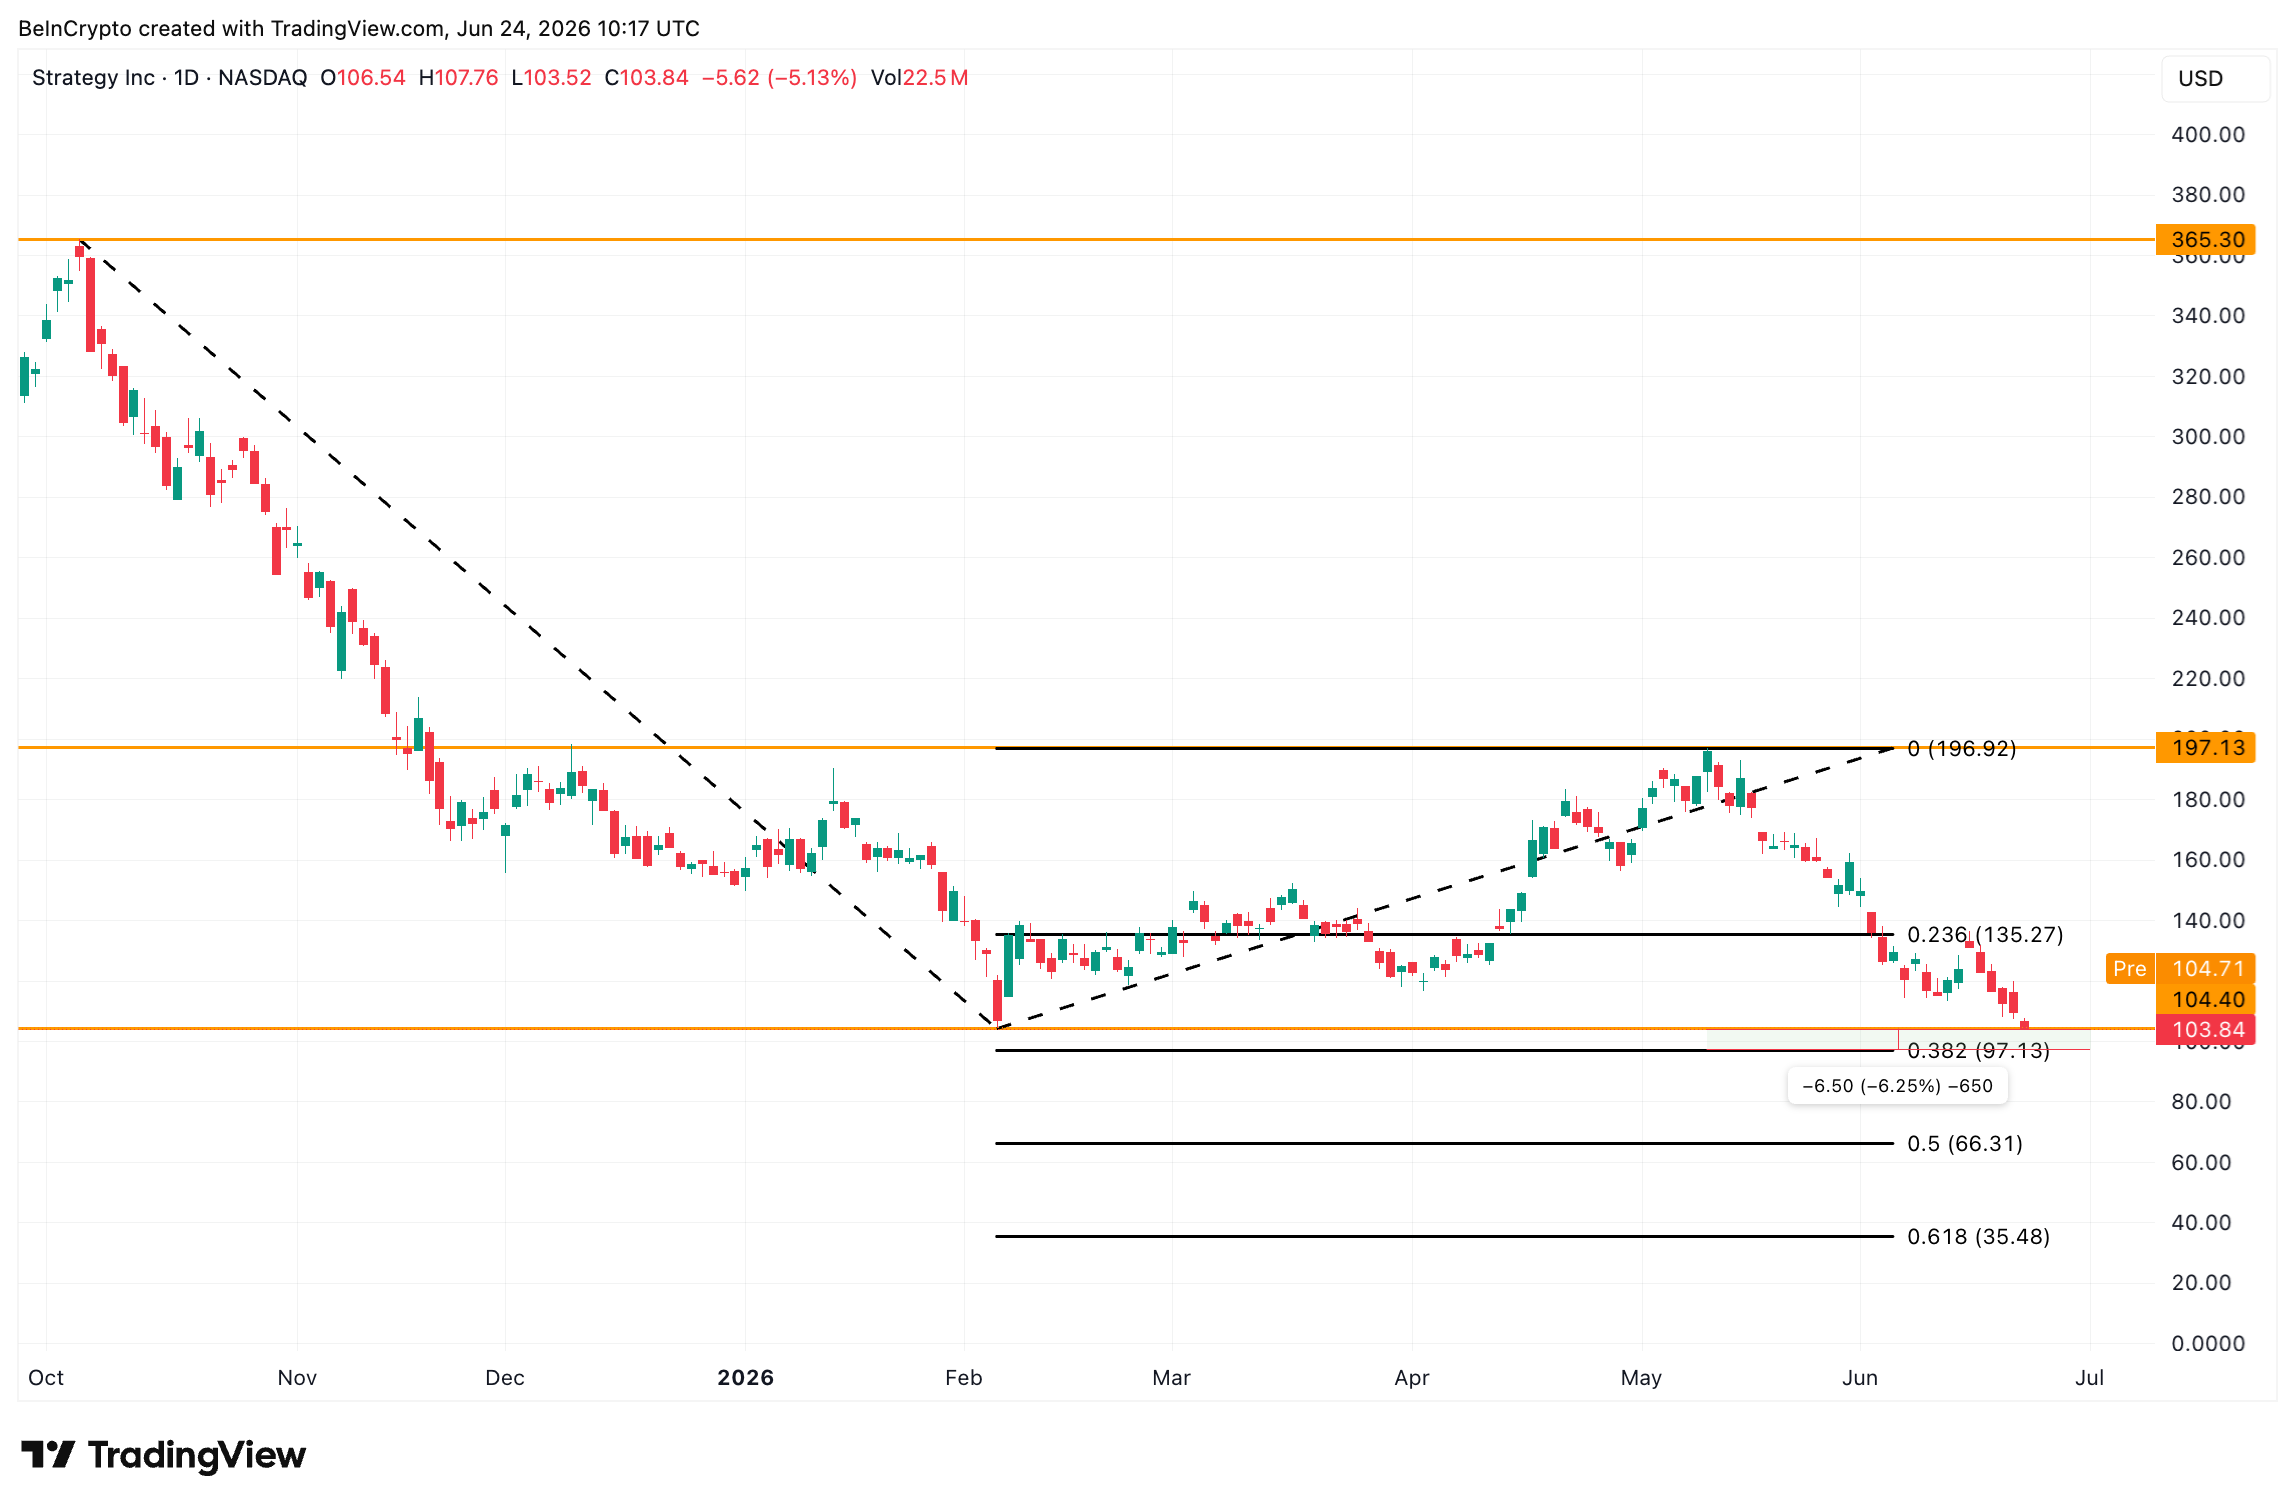
One caveat applies. A double bottom only confirms on a strong move up on rising volume, so without that push the pattern can still fail.
For MicroStrategy stock, $135.27 separates a real recovery from a bounce that fades, while $103.84 separates a holding pattern from a slide toward $97.13.
The post MicroStrategy Is Now Cheaper Than the Bitcoin It Owns appeared first on BeInCrypto.


Ripple has secured preliminary approval for the EU’s MiCA regulation. It is a milestone, but was, sadly, not an XRP catalyst. The post Ripple MiCA
Bill Morgan wants Ripple to relock less of its monthly XRP escrow release, but CTO Emeritus David Schwartz has drawn a firm line on acceleration.

Google’s nuclear strategy could redefine energy procurement, influencing tech industry power dynamics and boosting demand for nuclear tech. The post Google’s nuclear technology strategy advances
The creation of sports-linked memecoins like $LIONEL highlights the volatile nature of attention-driven crypto markets, lacking athlete consent. The post Lionel Mpasi’s World Cup heroics