

Crypto’s top 10 looks very different today compared with 10 years ago. The market was once filled with payment-focused coins that tried to become faster or cheaper versions of Bitcoin. But today, the ranking included smart contract networks, stablecoins, an exchange ecosystem token, and even newer blockchain infrastructure projects.
Actually, only four cryptocurrencies from the “2016 top 10” still held a place in 2026: Bitcoin, Ethereum, XRP, and Dogecoin. The other six positions changed hands as projects such as Litecoin, Dash, Lisk, and NEM lost their former market status.
Bitcoin remained the clear leader throughout the full period, although its share of the combined top 10 market capitalization fell from around 87% in 2016 to nearly two-thirds in 2026. Also, stablecoins became a major part of the ranking, while BNB showed that an exchange-linked token could grow into one of the world’s largest crypto assets.

The composition of crypto’s top tier shows how people stopped caring only about normal payment coins and started liking infrastructure tokens more.
Basically, back in 2016, the top list had mostly early digital cash projects like Bitcoin, Ethereum, Litecoin, Dash, and Dogecoin. These coins were just for sending money to each other, but only Bitcoin and XRP are still in the top list today.
Then in 2018, new smart-contract networks and copies like Bitcoin Cash (BCH), EOS, and Cardano (ADA) got into the top 10. Well, their rise showed that investors were becoming more interested in programmable blockchains that could support applications and services.
The next big change happened between 2019 and 2021. Tether (USDT) joined the top 10 list in 2020 because the market was quite volatile due to COVID-19, and people wanted coins with stable prices. Also, BNB came into the top 10 in 2019. It started as a token to get trading discounts on the Binance exchange, and soon it took 3 to 5 percent of the top 10 market value.
Next, around 2020 and 2021, DeFi and NFTs became super popular. This hype pushed other platform tokens like Polkadot (DOT), Uniswap (UNI), and MATIC into the top 10, but only for a little while.
By 2022, the top list started to look like what we see today. It had main infrastructure tokens like BTC, ETH, BNB, and SOL, plus stablecoins like USDT and USDC, making up most of the spots. Old payment coins like Litecoin and Bitcoin Cash dropped out completely. They were replaced by tokens that run big blockchain networks, crypto exchanges, or lending systems. Hence, this shift proves that the crypto market does not care about just moving money anymore. Now, it is all about fast networks, making smart contracts work, and pool liquidity.
You will see how fast things change in this market if you compare the top 10 crypto list from 2016 to 2026. Back in 2016, the top group had coins like BTC, ETH, LTC, XRP, Dash, Lisk, Dogecoin, and NEM. But today in 2026, the list looks totally different with BTC, ETH, USDT, BNB, XRP, USDC, Solana, Tron, Dogecoin, and Hyperliquid. Only Bitcoin, Ethereum, XRP, and Dogecoin managed to stay on the list. This means 60% of the old coins got kicked out over the years.
| Rank | 2016 Top 10 Cryptocurrency | 2026 Top 10 Cryptocurrencies |
| 1 | Bitcoin | Bitcoin |
| 2 | Ethereum | Ethereum |
| 3 | Litecoin | Tether |
| 4 | XRP | BNB |
| 5 | The DAO | USDC |
| 6 | Dash | XRP |
| 7 | NEM | Solana |
| 8 | MaidSafeCoin | TRON |
| 9 | Dogecoin | Hyperliquid |
| 10 | Lisk | Dogecoin |
A lot of the early coins did not have anything special to keep them on top. Let’s say, for example, Dash and NEM lost their hype when better privacy coins and smart-contract networks came out. People used to call Litecoin “digital silver,” but its value went down because investors started moving to much faster blockchains and layer-2 networks.
Also, some coins like Cardano, Polygon, and Polkadot jumped high into the top 10 during crazy market hypes, but they also could not hold their big positions for long. Now, on the other side, new names on the list like Hyperliquid are all about derivatives trading, which shows that crypto is always bringing in new types of financial platforms.
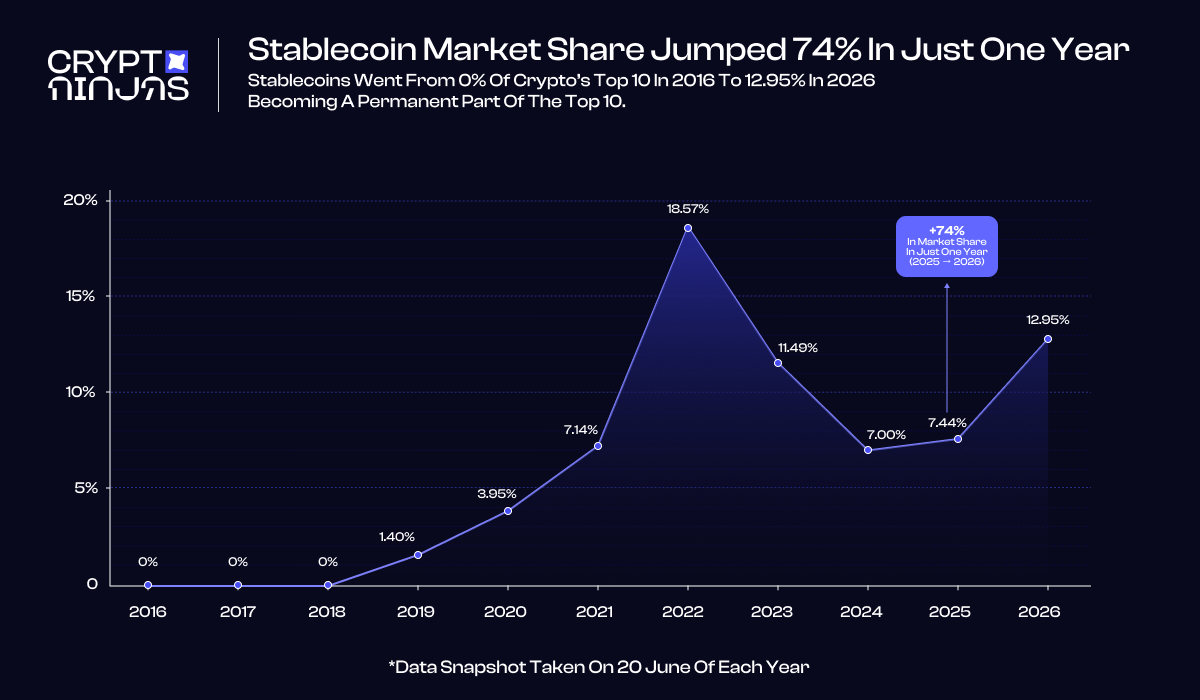
Stablecoins were basically not even on the top 10 list between 2016 and 2019. Tether (USDT) entered the top list for the first time in 2020, and it took about 3.9% of the total top 10 market value. Then by 2022, the total share of stablecoins like USDT, USDC, and BUSD reached its highest, around 18.5%.
The total share of stablecoins in the top 10 jumped from around 7.44% in 2025 all the way to 12.95% in 2026. Well, this big 74% growth happened because people wanted safe and liquid assets as crypto lending and yield projects became more mature. Today, USDT has 9.24% of the market share and sits as the third-largest crypto asset, and at the same time, USDC holds a 3.7% share, which makes it the fifth-largest crypto asset on the market.
Bitcoin has always stayed on top since the start of crypto, but yes, its actual share of the top 10 market value went down over time. You see, back in 2016, Bitcoin held about 87% of the total top 10 value. But Ethereum came out that same year with an 7.23% share, which right away took away some of Bitcoin’s dominance.
Now, over the next few years, Bitcoin’s share changed a lot. It dropped to 44.3% in 2017 because the big altcoin boom made smaller coins shoot up. Then it went back up over 74% in 2020 during the DeFi hype, and now it sits around 64% in 2026.
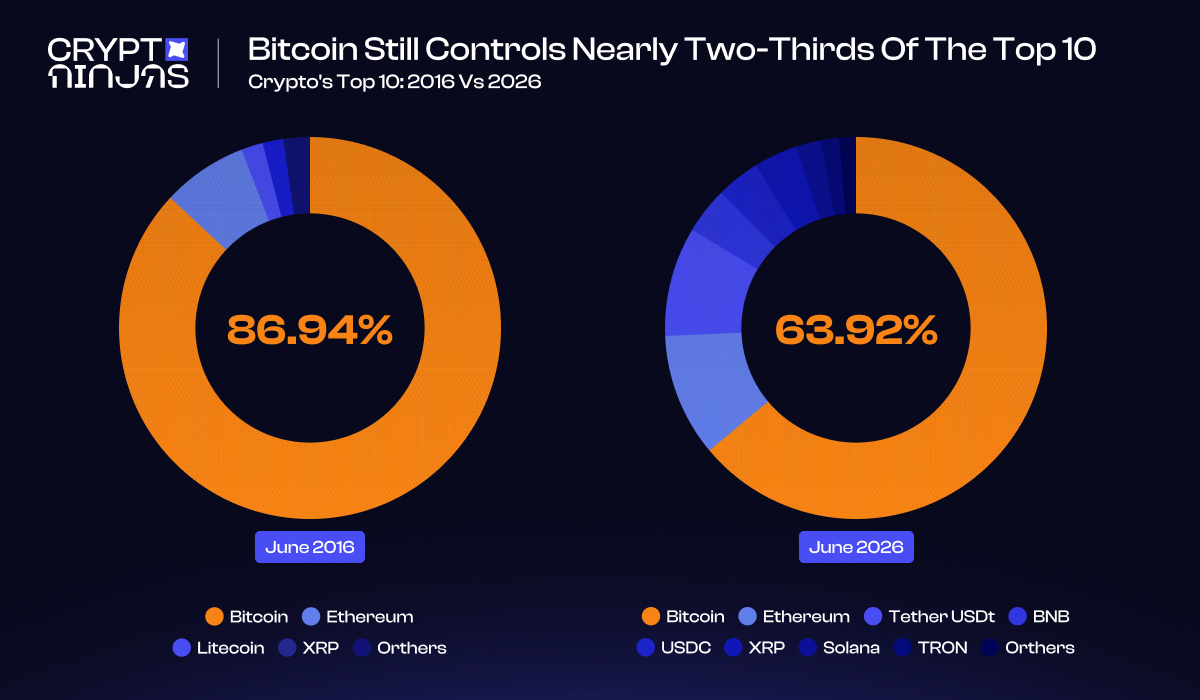
There are a few main reasons why Bitcoin keeps its top position. First, it has the network effect, as it is the oldest blockchain with the most secure network and the biggest brand name in the world. Second, big companies and institutions are buying it through things like ETFs and regulated platforms, treating it like “digital gold”. Third, Bitcoin has a fixed supply and halving events. So, this makes investors view it as a great asset to fight inflation. Still, the fact that its market share dropped over the years shows that new competitors like stablecoins and exchange tokens are becoming much bigger.
XRP is the only asset apart from Bitcoin to appear in every annual top 10 snapshot from 2016 through 2026. Its position changed over time, but it never dropped outside the group. XRP ranked third in 2016. It later moved between fourth and seventh place as Ethereum, stablecoins, BNB, and other networks increased their market capitalizations. XRP recovered to fourth in 2025 before holding sixth position in the 2026 snapshot.
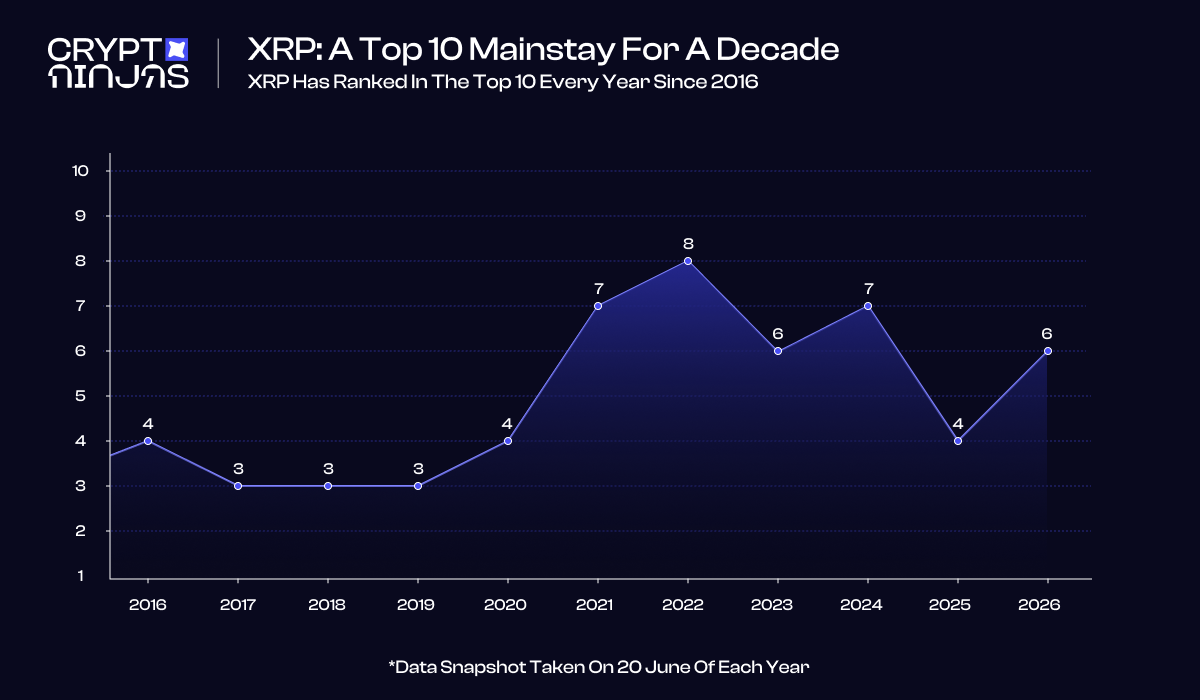
Actually, this record stands out because most of XRP’s former competitors did not survive. To be exact, Litecoin remained in the top 10 for years before falling behind newer assets. Plus, Dash and NEM lost their positions much earlier, while EOS and Bitcoin Cash declined after reaching high rankings during previous market cycles.
XRP’s long-term position came from its established community, strong liquidity, exchange availability, and continued focus on cross-border payments and settlement.
Binance Coin (BNB) made history because it was the very first exchange token to get into the top 10 list. It started in 2017 just as a utility token to help users get cheaper trading fees on the Binance platform. But by 2019, BNB broke straight into the top 10 and took about 2% of the total top 10 market value. By 2021, its share grew to more than 4%, and it locked down the fourth-place spot by 2026.
Binance did not just stop at fee discounts; they gave BNB a lot of other uses. They used it for staking, paying for gas fees on the BNB Chain, and joining token sales on their Launchpad platform. Since Binance grew into the biggest crypto exchange in the world, BNB got super popular from all this utility and the regular coin burns that cut down its supply.
Well, this massive success made other cryptocurrency exchanges copy them and launch their own tokens, like FTX Token (FTT) and KuCoin Token (KCS), but none of them ever got as big as BNB.
This study used crypto market cap data taken directly from CoinMarketCap. We took a snapshot on June 20 of every year from 2016 all the way to 2026.
Basically, for each year, we picked the 10 biggest cryptocurrencies based on their market cap. To find the market share of each coin, we took its individual market cap and divided it by the total market cap of all the top 10 assets combined for that year.
When we calculated stablecoin numbers, we included USDT, USDC, and BUSD anytime they showed up in the annual top 10 list. This comparison only looks at the changes inside the top 10 list itself, not how much share each coin has in the whole entire crypto market.
Attribution: Feel free to reference these findings in your own work. If you do, a link back to the original study on CryptoNinjas helps support future research and data‑driven reports.
Top 10 Cryptos by Market Cap — June 20, 2016
| Rank | Name | Symbol | Market Cap | Share of Top 10 |
| 1 | Bitcoin | BTC | $11,561,081,399.77 | 86.94% |
| 2 | Ethereum | ETH | $961,616,679.64 | 7.23% |
| 3 | Litecoin | LTC | $245,221,829.07 | 1.84% |
| 4 | XRP | XRP | $232,628,842.88 | 1.75% |
| 5 | The DAO | DAO | $92,048,339.48 | 0.69% |
| 6 | Dash | DASH | $54,195,370.77 | 0.41% |
| 7 | NEM | XEM | $50,343,001.26 | 0.38% |
| 8 | MaidSafeCoin | MAID | $34,573,677.75 | 0.26% |
| 9 | Dogecoin | DOGE | $33,886,227.89 | 0.25% |
| 10 | Lisk | LSK | $32,378,548.38 | 0.24% |
Top 10 Cryptos by Market Cap — June 20, 2017
| Rank | Name | Symbol | Market Cap | Share of Top 10 |
| 1 | Bitcoin | BTC | $44,643,549,369.82 | 44.34% |
| 2 | Ethereum | ETH | $33,260,998,920.77 | 33.03% |
| 3 | XRP | XRP | $12,422,416,456.11 | 12.34% |
| 4 | Litecoin | LTC | $2,438,535,401.16 | 2.42% |
| 5 | Ethereum Classic | ETC | $2,011,906,186.65 | 2.00% |
| 6 | NEM | XEM | $1,794,086,828.63 | 1.78% |
| 7 | Dash | DASH | $1,385,803,577.10 | 1.38% |
| 8 | IOTA | MIOTA | $1,163,217,701.74 | 1.16% |
| 9 | BitShares | BTS | $868,552,830.65 | 0.86% |
| 10 | Monero | XMR | $704,879,660.72 | 0.70% |
Top 10 Cryptos by Market Cap — June 20, 2018
| Rank | Name | Symbol | Market Cap | Share of Top 10 |
| 1 | Bitcoin | BTC | $115,916,295,536.57 | 49.11% |
| 2 | Ethereum | ETH | $53,735,015,065.82 | 22.77% |
| 3 | XRP | XRP | $21,164,427,687.19 | 8.97% |
| 4 | Bitcoin Cash | BCH | $15,311,031,511.14 | 6.49% |
| 5 | EOS | EOS | $9,335,740,335.21 | 3.95% |
| 6 | Litecoin | LTC | $5,592,176,148.32 | 2.37% |
| 7 | Stellar | XLM | $4,320,819,880.24 | 1.83% |
| 8 | Cardano | ADA | $4,199,808,368.30 | 1.78% |
| 9 | TRON | TRX | $3,247,546,817.10 | 1.38% |
| 10 | IOTA | MIOTA | $3,228,402,491.26 | 1.37% |
Top 10 Cryptos by Market Cap — June 20, 2019
| Rank | Name | Symbol | Market Cap | Share of Top 10 |
| 1 | Bitcoin | BTC | $169,304,784,791.18 | 66.75% |
| 2 | Ethereum | ETH | $28,955,655,289.97 | 11.42% |
| 3 | XRP | XRP | $18,268,310,634.27 | 7.20% |
| 4 | Litecoin | LTC | $8,442,646,196.59 | 3.33% |
| 5 | Bitcoin Cash | BCH | $7,381,555,719.71 | 2.91% |
| 6 | EOS | EOS | $6,296,160,412.41 | 2.48% |
| 7 | Binance Coin | BNB | $5,184,819,736.43 | 2.04% |
| 8 | Bitcoin SV | BSV | $3,880,633,278.02 | 1.53% |
| 9 | Tether | USDT | $3,548,510,405.03 | 1.40% |
| 10 | Stellar | XLM | $2,358,318,464.15 | 0.93% |
Top 10 Cryptos by Market Cap — June 20, 2020
| Rank | Name | Symbol | Market Cap | Share of Top 10 |
| 1 | Bitcoin | BTC | $171,809,438,650.59 | 74.03% |
| 2 | Ethereum | ETH | $25,548,837,121.25 | 11.01% |
| 3 | Tether | USDT | $9,177,740,880.57 | 3.95% |
| 4 | XRP | XRP | $8,342,603,851.03 | 3.59% |
| 5 | Bitcoin Cash | BCH | $4,276,469,120.61 | 1.84% |
| 6 | Bitcoin SV | BSV | $3,196,423,460.29 | 1.38% |
| 7 | Litecoin | LTC | $2,811,334,445.30 | 1.21% |
| 8 | Binance Coin | BNB | $2,495,984,577.26 | 1.08% |
| 9 | EOS | EOS | $2,355,096,827.73 | 1.01% |
| 10 | Crypto.com Coin | CRO | $2,074,819,546.84 | 0.89% |
Top 10 Cryptos by Market Cap — June 20, 2021
| Rank | Name | Symbol | Market Cap | Share of Top 10 |
| 1 | Bitcoin | BTC | $668,968,868,769.75 | 54.86% |
| 2 | Ethereum | ETH | $261,416,943,133.96 | 21.44% |
| 3 | Tether | USDT | $62,631,120,301.17 | 5.14% |
| 4 | Binance Coin | BNB | $52,177,493,482.09 | 4.28% |
| 5 | Cardano | ADA | $45,657,297,092.32 | 3.74% |
| 6 | Dogecoin | DOGE | $36,545,750,821.57 | 3.00% |
| 7 | XRP | XRP | $35,873,098,743.80 | 2.94% |
| 8 | USD Coin | USDC | $24,440,364,970.14 | 2.00% |
| 9 | Polkadot | DOT | $19,717,389,790.59 | 1.62% |
| 10 | Uniswap | UNI | $11,967,307,035.91 | 0.98% |
Top 10 Cryptos by Market Cap — June 20, 2022
| Rank | Name | Symbol | Market Cap | Share of Top 10 |
| 1 | Bitcoin | BTC | $392,888,024,958.71 | 51.82% |
| 2 | Ethereum | ETH | $136,722,871,083.63 | 18.03% |
| 3 | Tether | USDT | $67,853,470,373.85 | 8.95% |
| 4 | USD Coin | USDC | $55,744,749,203.38 | 7.35% |
| 5 | BNB | BNB | $35,420,370,612.84 | 4.67% |
| 6 | Binance USD | BUSD | $17,174,411,094.74 | 2.27% |
| 7 | Cardano | ADA | $16,608,404,988.07 | 2.19% |
| 8 | XRP | XRP | $15,631,560,627.04 | 2.06% |
| 9 | Solana | SOL | $12,130,694,927.91 | 1.60% |
| 10 | Dogecoin | DOGE | $7,983,700,626.10 | 1.05% |
Top 10 Cryptos by Market Cap — June 20, 2023
| Rank | Name | Symbol | Market Cap | Share of Top 10 |
| 1 | Bitcoin | BTC | $549,771,733,917.46 | 56.54% |
| 2 | Ethereum | ETH | $215,424,018,944.87 | 22.15% |
| 3 | Tether | USDT | $83,209,062,147.74 | 8.56% |
| 4 | BNB | BNB | $38,600,804,407.17 | 3.97% |
| 5 | USD Coin | USDC | $28,539,047,808.31 | 2.93% |
| 6 | XRP | XRP | $25,632,026,206.04 | 2.64% |
| 7 | Cardano | ADA | $9,441,258,593.36 | 0.97% |
| 8 | Dogecoin | DOGE | $8,816,852,728.89 | 0.91% |
| 9 | Solana | SOL | $6,645,682,933.39 | 0.68% |
| 10 | TRON | TRX | $6,354,531,687.32 | 0.65% |
Top 10 Cryptos by Market Cap — June 20, 2024
| Rank | Name | Symbol | Market Cap | Share of Top 10 |
| 1 | Bitcoin | BTC | $1,278,081,520,105.02 | 61.51% |
| 2 | Ethereum | ETH | $429,318,923,899.21 | 20.66% |
| 3 | Tether USDt | USDT | $112,823,559,454.03 | 5.43% |
| 4 | BNB | BNB | $86,647,496,287.86 | 4.17% |
| 5 | Solana | SOL | $61,666,356,472.92 | 2.97% |
| 6 | USDC | USDC | $32,657,695,097.47 | 1.57% |
| 7 | XRP | XRP | $27,181,503,154.20 | 1.31% |
| 8 | Dogecoin | DOGE | $18,015,069,916.09 | 0.87% |
| 9 | Toncoin | TON | $17,575,685,355.70 | 0.85% |
| 10 | Cardano | ADA | $13,730,790,550.29 | 0.66% |
Top 10 Cryptos by Market Cap — June 20, 2025
| Rank | Name | Symbol | Market Cap | Share of Top 10 |
| 1 | Bitcoin | BTC | $2,053,957,229,383.58 | 70.29% |
| 2 | Ethereum | ETH | $290,610,544,180.88 | 9.95% |
| 3 | Tether USDt | USDT | $155,964,249,280.22 | 5.34% |
| 4 | XRP | XRP | $124,970,388,051.41 | 4.28% |
| 5 | BNB | BNB | $90,418,443,802.06 | 3.09% |
| 6 | Solana | SOL | $74,424,463,564.00 | 2.55% |
| 7 | USDC | USDC | $61,267,803,199.68 | 2.10% |
| 8 | TRON | TRX | $25,829,116,131.57 | 0.88% |
| 9 | Dogecoin | DOGE | $24,333,951,881.41 | 0.83% |
| 10 | Cardano | ADA | $20,414,748,066.60 | 0.70% |
Top 10 Cryptos by Market Cap — June 20, 2026
| Rank | Name | Symbol | Market Cap | Share of Top 10 |
| 1 | Bitcoin | BTC | $1,287,727,861,549.17 | 63.92% |
| 2 | Ethereum | ETH | $209,905,735,178.57 | 10.42% |
| 3 | Tether USDt | USDT | $186,213,095,328.57 | 9.24% |
| 4 | BNB | BNB | $79,200,609,348.12 | 3.93% |
| 5 | USDC | USDC | $74,842,443,865.94 | 3.71% |
| 6 | XRP | XRP | $71,303,147,362.26 | 3.54% |
| 7 | Solana | SOL | $42,461,411,305.12 | 2.11% |
| 8 | TRON | TRX | $30,952,703,251.86 | 1.54% |
| 9 | Hyperliquid | HYPE | $17,889,782,333.94 | 0.89% |
| 10 | Dogecoin | DOGE | $14,249,514,073.13 | 0.71% |
The post Top 10 Cryptos 2016‑2026: Only Four Coins Survived as 60% Were Replaced appeared first on CryptoNinjas.


The escalation threatens global energy stability, impacting market confidence and maritime traffic, with potential for further regional conflict. The post Iranian drones attack Bahrain, tanker
Nvidia’s investment in AI-driven drug discovery could revolutionize biotech, highlighting AI’s growing role in diverse industries beyond tech. The post Nvidia invests in Generate Biomedicines,
The shift towards equal-weighted indices suggests a diversification trend, potentially boosting broader market participation and alternative assets. The post S&P 500 equal-weighted index outperforms cap-weighted
Solana (SOL) is drawing fresh attention from technical traders after holding a pronounced ‘bullish divergence’ despite a sharp recent sell-off—an indicator that often suggests downside