The token has shown consistent buying activity over the last 24 hours, and its price has bounced back, with technical indicators also indicating a favorable trend.
This is the same technical challenge that is emphasized in current chart studies. HBAR is nearing the area of resistance that thwarted its previous rally, and the momentum indicators remain bullish. The structure is definitely improving, but a solid breakout is still required for the general trend to turn higher definitively, analysts note.
More Crypto Online noted that $0.074-$0.08 would be the next main support level on the four-hour chart.
The Elliott Wave analysis suggests that HBAR is facing resistance during the second wave of a potential third wave pattern. The zone is an important technical area for the ongoing recovery, as there are multiple Fibonacci levels within it.
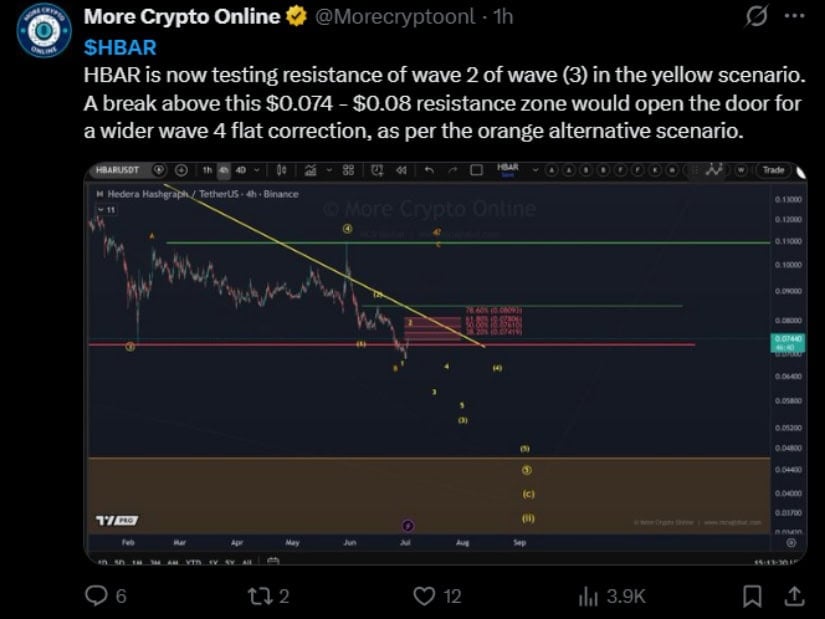
If it can be expected to break above this resistance, the market could move into a larger wave-four recovery scenario, as per the chart. But is the zone not going to be a hurdle for buyers unless they are able to cross it before another push-up?
At present, the analysis is still preliminary. The chart is not indicating a breakout; rather, it is marking the current resistance band as the level that will set up the next direction.
The short-term momentum seems to have strengthened on the 30-minute chart of TradingView.
Since the recent rebound started, buyers have been dominating the short-term trend as HBAR has made higher highs and higher lows.
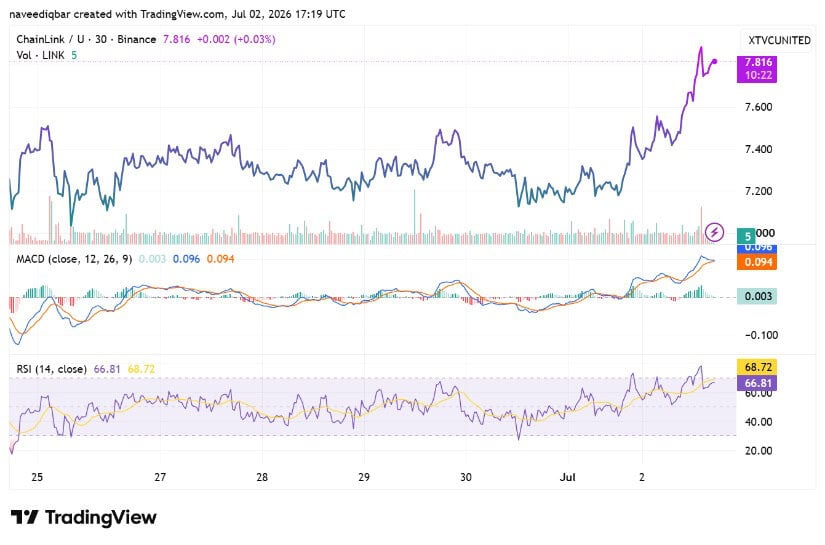
According to the chart, MACD is still above the zero line, with both the MACD and the signal lines still rising. The histogram is now beginning to level off a bit, but there’s still a positive trend.
The Relative Strength Index (RSI) has, meanwhile, risen to approximately 67, which means HBAR is nearing overbought levels but not at a high enough level to be considered an alert signal. This implies that the buying momentum is still strong, but traders could be alert for any signs of consolidation if there is any pause in trading at the resistance level.
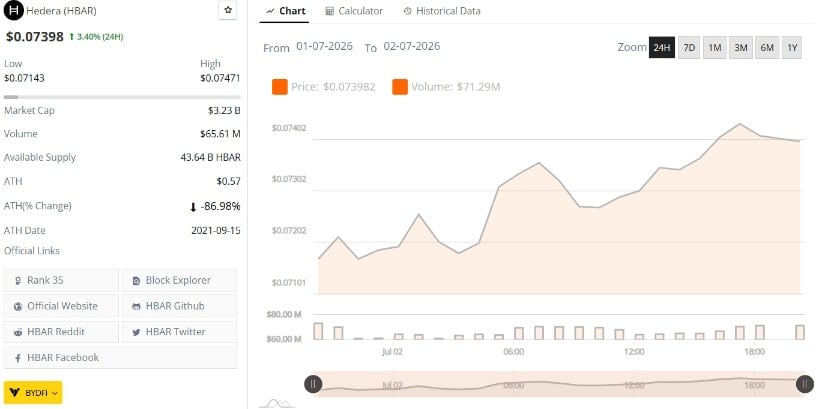
Meanwhile, the market conditions have also improved in the BraveNewCoin market data. HBAR was trading at around $0.074, rising about 3% in the last 24 hours and hitting an intraday high of nearly $0.0747. Buyers absorbed the selling pressure gradually throughout the session, with the price eventually stabilizing, albeit higher than it was at the start of the trading session.
Even so, the technical chart outlook is still a positive one, but it is slightly incomplete. HBAR has now returned to a critical resistance level, and the momentum indicators are indicating a bull market.
The price action over the short-term is still improving, and the momentum indicators are pointing in favor of the buyers, and HBAR has entered a critical resistance zone. Bulls will now be closely monitored to see if they can break out of this range on the higher side ($0.074 – $0.08) to confirm the next leg of the recovery.