

The immediate focus is on the $0.29-$0.30 support zone, where a sustained breakdown could expose WLD to lower levels.
The latest 4-hour technical setup suggests that Worldcoin may have completed a corrective bullish phase and entered another bearish leg. One analysis identifies this move as Wave C, following the completion of Waves A and B. If sellers retain control, the next test could come at the recent lows.
However, the broader setup is not uniformly bearish. WLD has been consolidating above its local floor, while several momentum indicators are approaching oversold territory. That leaves room for a relief rebound if buyers defend support.
At the time of writing, WLD is trading near $0.31, according to current market data.
The 4-hour chart presents the clearest near-term bearish signal. According to the technical setup, WLD’s previous bullish Wave F appears to have ended, with the token subsequently shifting into a bearish structure.
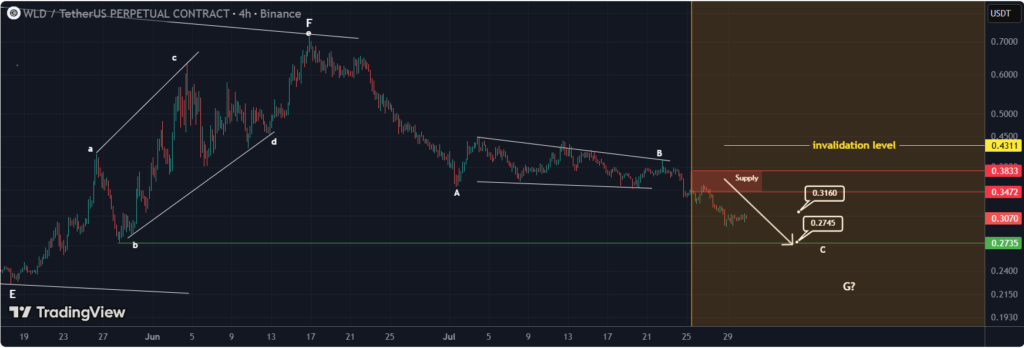
The bullish Wave F appears complete, with WLD now entering a bearish Wave C after Waves A and B concluded. Source: behdark on TradingView
The analysis suggests that Waves A and B of this decline have already developed, leaving Wave C as the potential next phase. In this framework, a rejection from the identified supply zone would strengthen the bearish case and put lower chart targets back into focus.
The $0.29-$0.30 area is therefore an important technical test. WLD has recently traded around this region, making it a key reference point for determining whether the current consolidation becomes another leg lower or develops into a base.
A sustained move below support would weaken the short-term structure further. By contrast, a daily close above the setup’s invalidation level would undermine the bearish Wave C thesis.
This distinction is important because Elliott Wave interpretations are scenario-based rather than definitive forecasts. Price action ultimately determines whether the proposed wave structure remains valid.
WLD’s broader technical structure remains weak. The token has been trading below several major moving averages, leaving overhead resistance between roughly $0.35 and $0.47.
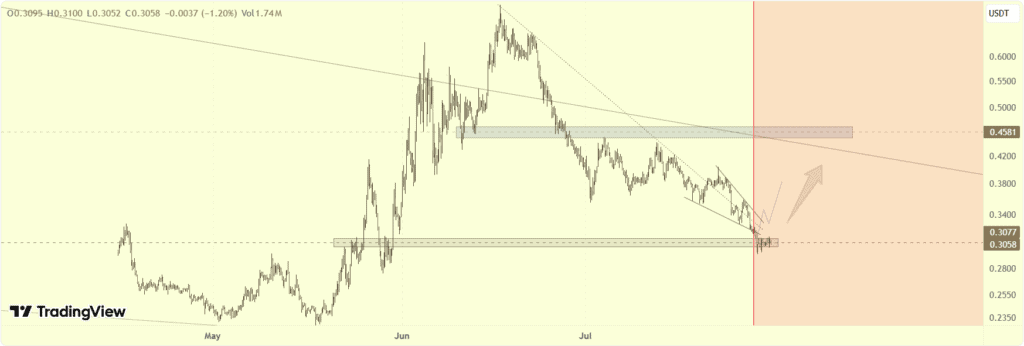
The setup anticipates a false breakout from the bullish pattern, followed by a retest of the marked support before a potential rebound, while the longer-term structure remains bearish. Source: MISANTHROPOS on TradingView
The first important resistance area sits around $0.328-$0.35. A sustained recovery through this zone could improve the short-term technical picture.
Above it, the $0.38 region becomes more significant because it aligns with the broader moving-average structure. Further resistance is located around $0.39-$0.42, followed by the $0.46-$0.47 area.
On the downside, $0.29-$0.30 represents the first support zone. Below that, technical levels around $0.27-$0.276 become relevant, while the broader support region sits near $0.23-$0.26.
These levels create a relatively clear framework for the Worldcoin price prediction. Holding $0.29-$0.30 would allow WLD to continue consolidating, while a decisive breakdown could shift attention toward the lower support bands.
Momentum indicators provide a more mixed picture.
Recent readings place the 14-period RSI in the low-30s to mid-40s range, depending on the timeframe and data source. That indicates weak momentum and, at the lower end of the range, conditions approaching oversold territory.
An oversold RSI alone does not establish a bottom. Instead, it indicates that selling pressure has become significant relative to recent price action. A sustained recovery in RSI alongside higher lows would provide stronger evidence of improving momentum.
The MACD remains in negative territory, with recent readings described as bearish or relatively flat around the zero line. This suggests that upside momentum has not yet established itself.
Other momentum indicators, including CCI, Stochastic and Williams %R, have also shown signs of weakness or potential exhaustion. CCI readings below -100, in particular, indicate an oversold condition.
The combination creates a notable divergence in the technical picture: moving averages remain broadly bearish, while oscillators suggest that downside momentum could be becoming less aggressive.
Another technical framework identifies $0.2625 as an important local low and demand zone. WLD has remained above this level following its decline from the much higher $0.7229 macro ceiling.
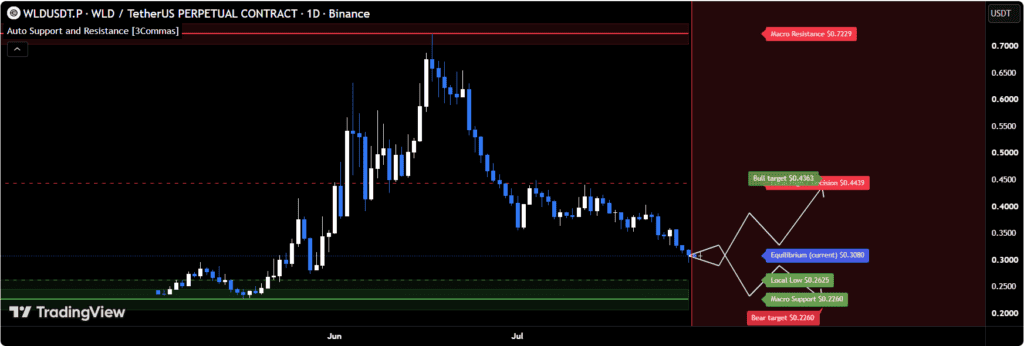
WLD has retreated from the $0.7229 macro ceiling to $0.3082 but remains above the $0.2625 local floor, suggesting consolidation and base formation rather than a confirmed breakdown. Source: 3Commas on TradingView
The analysis describes the current pattern as a “base rebuilding, not a breakdown,” provided the local floor continues to hold.
That distinction matters. A sustained hold above $0.2625 would preserve the possibility of a wider range recovery, even if the short-term trend remains weak.
A deeper support level sits at approximately $0.2260. A daily close below that area would represent a more significant structural deterioration under this framework.
On the upside, $0.4365 is identified as a measured-move objective, while $0.4439 marks a key local high. A daily close above $0.4439 would shift the local structure in a more constructive direction.
Therefore, the broader range can be viewed through three important areas: $0.2625 as the local floor, $0.4365-$0.4439 as the principal upside decision zone, and $0.2260 as deeper structural support.
The technical weakness becomes more pronounced when viewed against WLD’s longer-term price history.
Worldcoin reached an all-time high near $11.82 in March 2024, according to market reports, before falling to approximately $0.24 during a later selloff. That represented a decline of roughly 97% from the peak.
The scale of that decline means that even a substantial short-term rebound would not necessarily establish a long-term trend reversal.
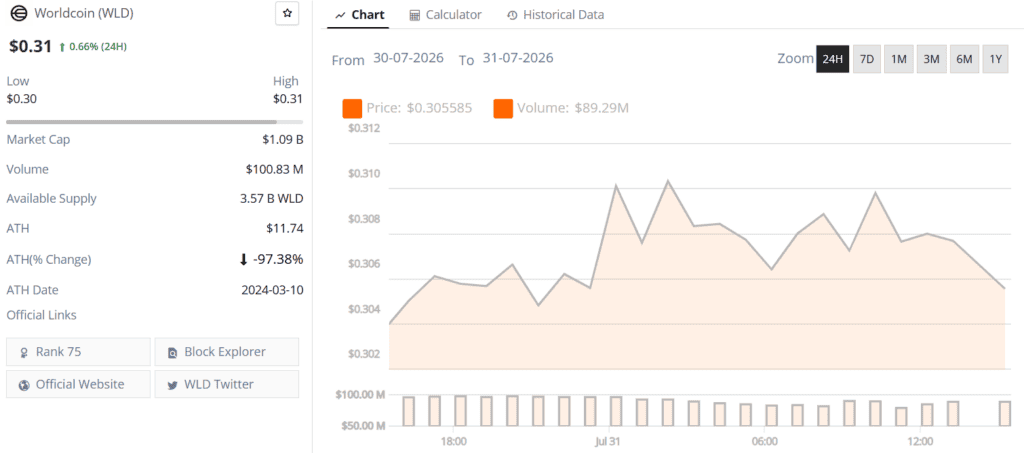
Worldcoin (WLD) price chart. Source: Brave New Coin
WLD’s position below the 50-day, 100-day and 200-day moving averages further reinforces the broader bearish structure. The cited technical ranges put the 50-day average around $0.39-$0.44, the 100-day average near $0.39-$0.41, and the 200-day average around $0.38-$0.45.
Those averages could therefore act as resistance if WLD begins to recover.
A move above the $0.35-$0.38 region would provide the first meaningful indication that buyers are regaining control. A stronger recovery through $0.39-$0.42 would offer additional confirmation.
Token supply dynamics are another factor relevant to the Worldcoin price outlook.
World’s official tokenomics update states that WLD’s aggregate daily unlock rate was scheduled to fall by 43% on July 24, 2026, from approximately 5.1 million WLD per day to 2.9 million WLD per day. The change applies to existing linear unlock schedules and does not create an unlock cliff.
The reduction includes a 50% decrease in the daily unlock rate for World Community tokens, from 3.2 million to 1.6 million WLD. Team and investor allocations were scheduled to decline by 32%, from 1.9 million to 1.3 million WLD per day.
World also reported that, as of April 10, approximately 4.9 billion WLD, or 49% of the token’s 10 billion initial supply, had been unlocked, with around 3.3 billion WLD in circulation at that time.
The lower daily unlock rate could reduce the pace at which new tokens enter the market. It does not, however, remove the broader supply expansion associated with the remaining unlock schedule.
According to World’s updated whitepaper, WLD launched on July 24, 2023, with an initial supply cap of 10 billion tokens. The document states that most WLD transactions now take place on World Chain, while the token remains an ERC-20 asset on Ethereum.
The immediate Worldcoin price prediction remains tied to the $0.29-$0.30 support zone.
A decisive breakdown below this area would strengthen the bearish Wave C scenario and bring the $0.27-$0.276 region into focus. If selling pressure persists beyond that level, the $0.23-$0.26 region becomes the next major area for buyers to defend.
A move below $0.2625 would be particularly important because that level currently represents the local range floor identified in the bullish recovery scenario. A further daily close below $0.2260 would invalidate that broader range structure.
The alternative scenario requires WLD to regain ground above resistance. A recovery through $0.328-$0.35 would be an initial improvement, while a sustained move above $0.35-$0.38 could challenge the bearish trend structure.
If buyers ultimately reclaim $0.38 and then the $0.39-$0.42 region, WLD could turn toward the $0.4365-$0.4439 area. A daily close above $0.4439 would provide a stronger technical signal that the local bearish structure has changed.
For now, however, the evidence remains mixed but tilted toward caution. WLD’s moving-average structure and broader trend favor sellers, while RSI, CCI and other oscillators suggest that downside momentum may be becoming stretched.
The next decisive move around $0.29-$0.30 support is therefore likely to be important for the short-term WLD price outlook. Until that level is clearly reclaimed or lost, the market remains caught between the risk of another decline and the possibility of a technical relief rebound.







