

The latest XRP price action reflects continued bearish momentum as sellers maintain control, while traders closely monitor whether the psychologically important $1.00 level can withstand further downside pressure.
The recent decline comes after Ripple XRP recorded its lowest daily close of 2026, reinforcing a broader downtrend that has developed over recent weeks. Although some technical indicators hint at oversold conditions, analysts largely agree that any short-term recovery could face heavy selling unless key resistance levels are reclaimed.
The XRP current price recently traded near $1.04 after falling below both short- and medium-term moving averages. On TradingView, crypto analysts highlighted a bearish Break of Structure (BoS) after XRP lost the $1.0473 swing low, signaling that the market structure continues to favor sellers.
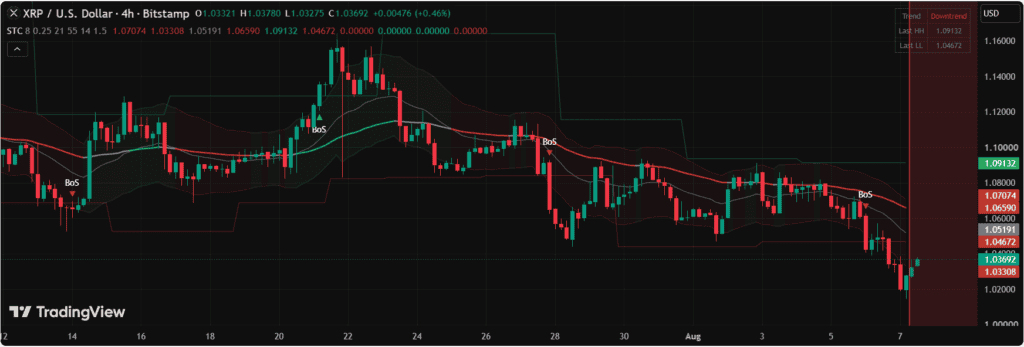
XRP traded below its lower volatility band, with bearish momentum strengthening as the 21- and 55-period EMAs continued to act as overhead resistance. Source: TradingView
According to the analysis, the 21-period Exponential Moving Average (EMA) around $1.0527 and the 55-period EMA near $1.0669 have now become overhead resistance. The analyst noted that the ideal bearish continuation setup would emerge if price rejects the $1.0473–$1.0527 zone or posts another four-hour close below approximately $1.0261.
The analyst identified $1.015 as the next liquidity target, with the $1.00 psychological level serving as the next major downside objective if selling pressure persists. However, a sustained four-hour close above the 55 EMA would invalidate the current bearish outlook.
Another market observer, ChartNerdTA, said XRP has now validated a bearish outlook first shared on July 31 after closing near $1.02, its weakest daily finish of the year.
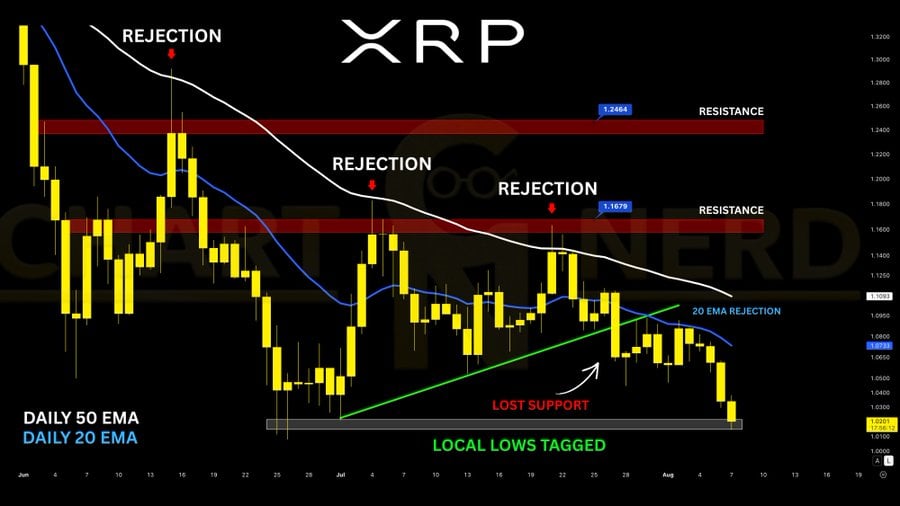
XRP recorded its lowest daily close of 2026 near $1.02 after breaking an ascending support trendline and retesting its June lows. Source: ChartNerd via X
The analyst’s chart shows repeated rejections from both the 20-day and 50-day exponential moving averages, along with several failed attempts to reclaim the $1.16-$1.24 resistance region. Together, these signals suggest that sellers remain firmly in control despite expectations for an eventual relief bounce.
ChartNerdTA expects any recovery to remain temporary unless XRP can reclaim major resistance levels. Until then, the analyst believes the market remains vulnerable to another test of the $1.00 area.
Independent analyst Rocksorgate described XRP as approaching a decisive point for the remainder of 2026, arguing that the price of XRP is now hovering near one of its most important long-term support zones.
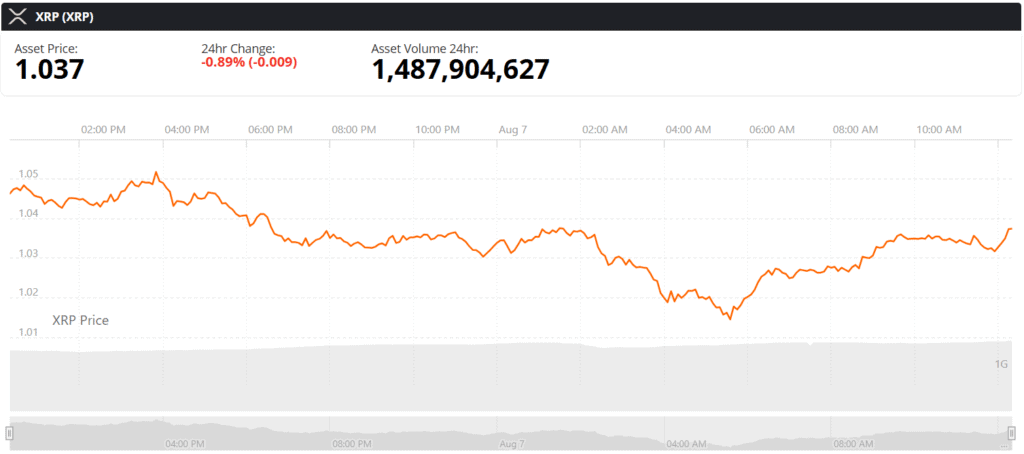
XRP price chart. Source: Brave New Coin
According to the analysis, the loss of the $1.05 horizontal support is particularly significant because it capped downside volatility for months before finally giving way. Once broken, that level has effectively transformed into resistance, increasing the likelihood that sellers defend any rebound.
Rocksorgate also noted that the $1.00 level aligns with the 0.618 Fibonacci retracement from XRP’s broader multi-year advance, making it more than just a psychological milestone.
“If $1.00 snaps on high volume,” the analyst wrote, “the bullish market structure breaks completely.”
The report added that exchange balances continue to decline as larger wallets holding more than 100,000 XRP quietly accumulate tokens, even as retail investors reduce exposure. That divergence suggests institutional-sized participants may be accumulating during periods of market weakness.
The latest TradingView technical summary presents a mixed but cautious picture for XRP price prediction.
Oscillators remain largely neutral, with the Relative Strength Index (RSI) around 38 suggesting XRP is approaching oversold territory without yet producing a confirmed reversal signal. Momentum indicators remain mixed, while the MACD continues to issue a bearish signal.
Moving averages paint a considerably weaker picture. Nearly every major moving average—from the 10-period EMA through the 200-period EMA—continues to generate sell signals, reflecting persistent downward momentum across multiple timeframes.
Pivot point analysis also places XRP below its central pivot level, with the first notable support zone positioned around $1.026 and stronger support emerging near $0.99. These levels could become increasingly important if selling pressure continues.
Despite the current weakness, ChartNerdTA maintains that historical market cycles continue to support a constructive long-term XRP prediction.
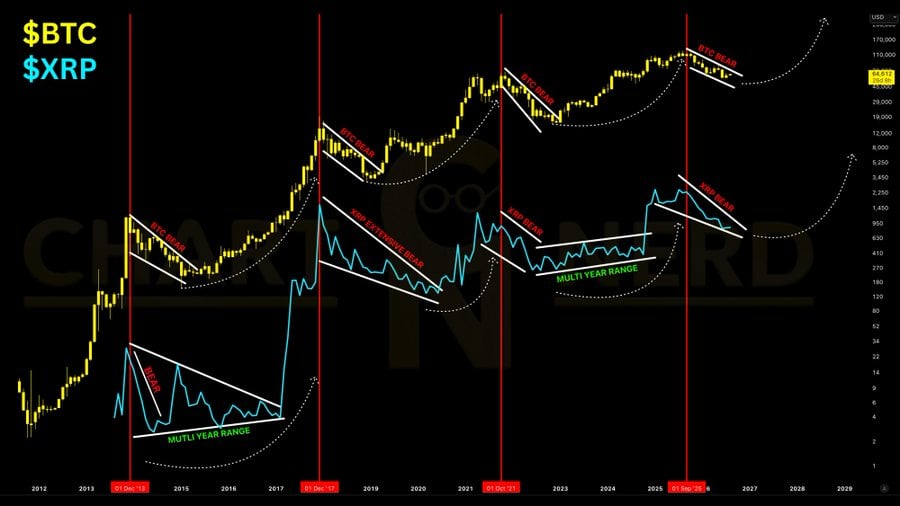
The analyst argues that XRP’s strongest gains have historically followed 70–90% bear markets and extended periods of underperformance against Bitcoin, often culminating in catch-up rallies near Bitcoin’s cycle peaks. Source: ChartNerd via X
The analyst pointed to previous cryptocurrency cycles dating back to 2012, arguing that XRP has historically delivered its strongest gains after prolonged periods of underperformance relative to Bitcoin. According to the comparison, extended bear markets and lengthy accumulation phases have often preceded significant catch-up rallies once broader market conditions improve.
While that historical pattern does not guarantee a similar outcome, it provides context for why some long-term investors continue monitoring XRP despite the ongoing correction.
For now, however, the near-term focus remains firmly on whether buyers can defend the $1.00 support area. Until XRP reclaims key resistance levels above $1.05 and the major moving averages, technical analysts broadly agree that the prevailing trend continues to favor the bears.






Grok AI predicts a Bitcoin bottom is in, with potential prices reaching $120,000 to $150,000 by the end of 2026. The post Elon Musk Grok
Arthur Hayes warns an AI-driven credit crisis will force Federal Reserve money printing, making Bitcoin the primary beneficiary with a potential $1M price target. The
On August 6, 2026, community-backed digital assets are demonstrating sustained market momentum, led by Pudgy Penguins’ massive content milestone and Maxi Doge’s $4.83 million capital

Kitesurf’s efficiency could revolutionize AI web interactions, reducing computational costs and enhancing scalability for automated tasks. The post Cloudflare launches Kitesurf, a browser built for

