



The Bitcoin price has struggled to build lasting upside momentum even as recent US inflation data has eased some pressure on risk assets.
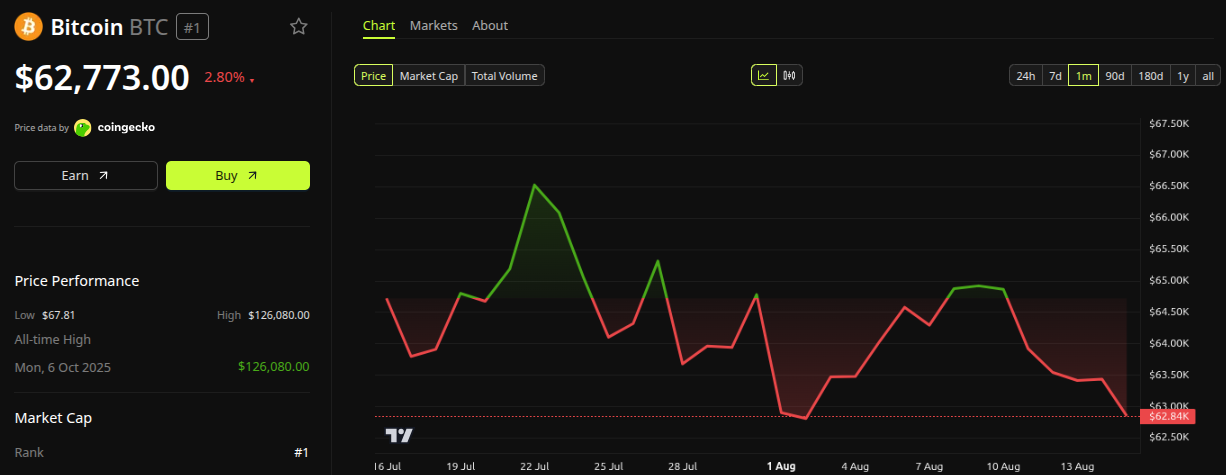
As of August 15, BTC was trading around $62,900, with market reports placing the cryptocurrency near the $63,000 level after a subdued reaction to softer US economic data.
The setup leaves Bitcoin caught between a well-established support zone and a series of overhead resistance levels. A sustained move below $62,000 could expose the market to deeper losses, while a successful defense followed by a recovery above $65,000 would improve the short-term technical picture.
The latest Bitcoin price action also comes against a backdrop of elevated derivatives positioning and relatively weak spot participation, creating conditions where a sharp move in either direction could quickly change market structure.
BTC has spent recent weeks moving within a broad sideways structure, repeatedly finding buyers near the lower end of the range and sellers toward the upper boundary.
The immediate support area identified by technical analysis sits around $62,200-$62,600. That zone has become particularly important because it overlaps with the current trading range’s lower boundary.
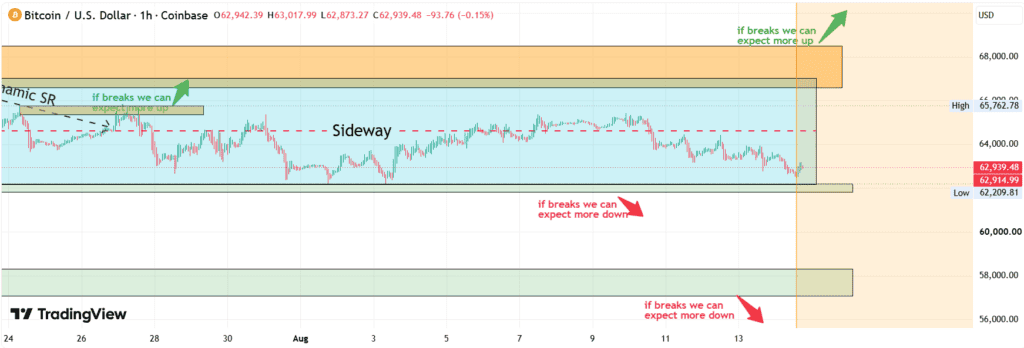
Bitcoin has been trapped inside a large sideways structure, with price repeatedly bouncing between the upper and lower boundaries. Source: TheZimpact on TradingView
TheZimpact described the level as the range’s “critical area,” arguing that holding it could allow Bitcoin to attempt another recovery toward $65,000. A move through the $66,000-$67,000 resistance area would then bring the $68,000-$69,000 region into focus.
Those levels are broadly consistent with the current market structure. Bitcoin’s recent attempts to recover have repeatedly struggled around the mid-$60,000s, while the lower $62,000 area has attracted attention as a potential balance point.
Recent market data also shows that this is not an isolated technical level. Bitcoin traded below $62,000 during the July selloff before recovering, demonstrating that liquidity remains concentrated around the zone.
One of the more important variables for the current Bitcoin price prediction is the relationship between futures positioning and actual trading activity.
Glassnode’s open-interest-to-volume metric measures outstanding futures positions relative to daily futures turnover. Its methodology notes that higher readings indicate positions are being held for longer relative to the amount of trading taking place.
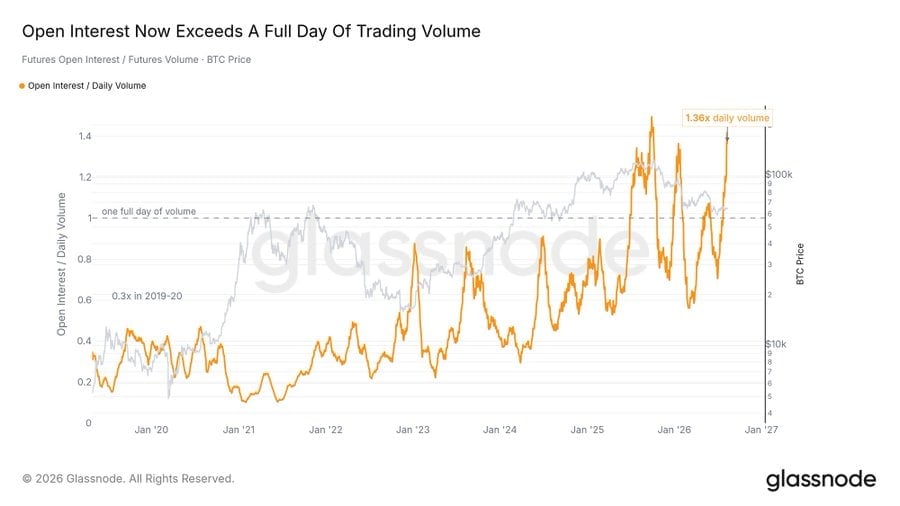
Glassnode data shows Bitcoin futures open interest rising to 1.36 times daily volume, nearing record levels amid thin trading activity. Source: @glassnode via X
The data referenced in the latest market analysis puts Bitcoin futures open interest at roughly 1.36 times daily futures volume, close to the high recorded last September.
That matters because a large derivatives position sitting against relatively thin turnover can make the market more sensitive to forced buying or selling. If prices move sharply, liquidations can accelerate the move as leveraged positions are closed.
Coinbase’s institutional research also identified elevated leverage as a feature of the 2026 market. Its July positioning report said BTC’s leverage ratio remained elevated even as absolute open interest had contracted, while the broader market was experiencing a period of de-risking.
This does not establish whether the next move will be bullish or bearish. It does, however, suggest that derivatives positioning could amplify a move once Bitcoin escapes its current range.
The other side of the equation is spot demand.
Bitcoin’s reaction to the latest US inflation data has been relatively muted. July CPI increased 3.4% year over year, down from 3.5% in June, while core CPI eased to 2.5%. Monthly CPI rose 0.1%, in line with expectations.
The data reduced some immediate pressure for another Federal Reserve rate increase, but Bitcoin did not translate the softer inflation backdrop into a sustained rally. Barron’s reported BTC around $63,330 on August 14, while noting that the market remained constrained by weak demand and ETF outflows.
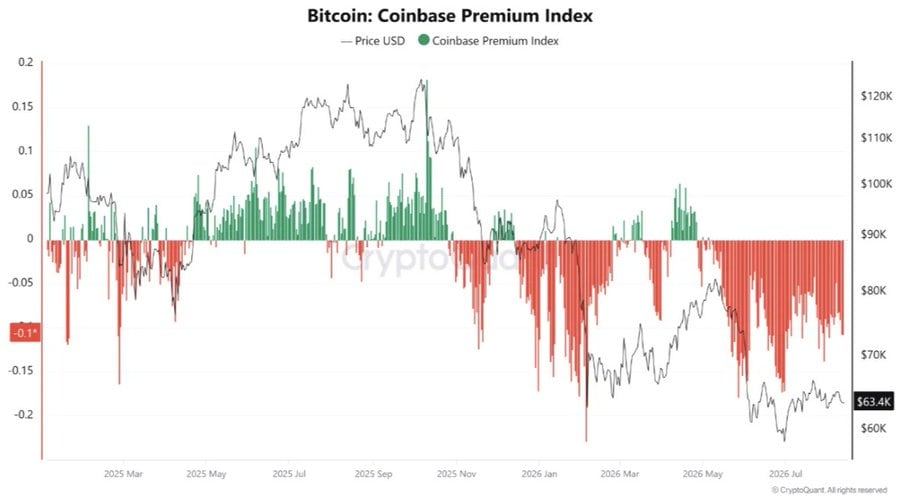
The Coinbase Premium Index has remained negative since May, pointing to weak US spot demand and ETF inflows amid thin liquidity and elevated futures leverage. Source: @cryptoquant_com via X
That response is important for the Bitcoin price forecast because favorable macroeconomic data normally provides a potential tailwind for risk assets. When price fails to respond, it can indicate that market-specific factors are carrying greater weight.
CryptoQuant’s analysis highlighted a similar issue through the Coinbase Premium Index. Persistent negative readings were interpreted as evidence of relatively weak US spot demand, while Bitcoin remained below the short-term holder cost basis near $68,700.
Coinbase’s own July research also reported that US spot Bitcoin ETF flows had deteriorated through June, although it noted that Coinbase order-book depth had shifted toward the bid side.
The combination leaves Bitcoin dependent on stronger spot participation if it is to sustain a move through the upper part of its current range.
The broader technical picture remains cautious.
TradingView’s technical dashboard shows a neutral overall reading, but the underlying moving-average signals lean decisively toward selling pressure. The analysis cited 14 sell signals, one neutral reading and no buy signals among the major moving averages.
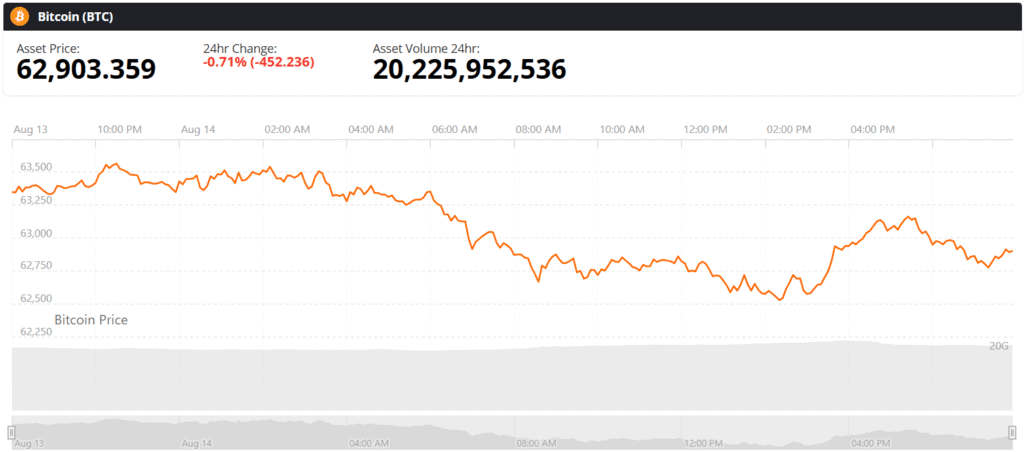
Bitcoin (BTC) price chart. Source: Brave New Coin
Bitcoin is trading below several short- and medium-term averages, including the 10-, 20-, 30- and 50-period measures. Longer-term averages are considerably higher, with the 100-period and 200-period averages positioned above the current market.
Momentum indicators are similarly mixed.
The Relative Strength Index at around 41 remains in neutral territory, meaning BTC is not technically oversold despite its recent decline. The Average Directional Index near 13 also points to a market lacking a strong directional trend.
At the same time, the MACD and Momentum readings remain negative. That combination suggests that Bitcoin has limited upside momentum while still lacking the conditions associated with a strongly established downtrend.
The technical picture can therefore be described as neutral on momentum but bearish on trend structure.
The immediate Bitcoin price prediction hinges on whether the $62,200-$62,600 region continues to attract buyers.
If the support zone holds, Bitcoin could attempt to recover toward $65,000. A sustained break above $66,000-$67,000 would represent a more meaningful improvement and could expose the $68,000-$69,000 region.
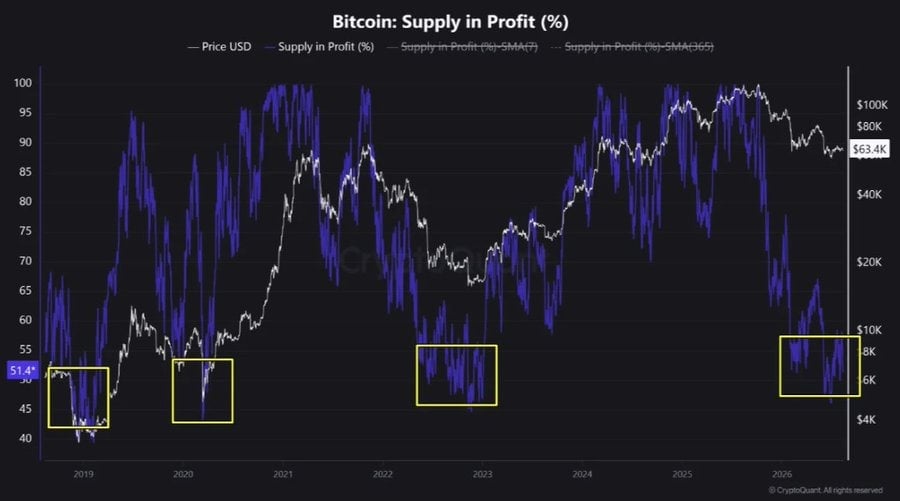
Short-term holders face substantial unrealized losses, while historically, long-term holders have tended to re-accumulate when profitability falls below 55%, a level often associated with market bottoms. Source: @cryptoquant_com via X
That area is especially relevant because CryptoQuant’s analysis places the short-term holder cost basis around $68,700. Reclaiming that level would therefore represent more than a routine bounce; it would put Bitcoin back above a major reference point for recent market participants.
On the downside, a decisive break beneath the $62,000 region would weaken the current range structure. Classic pivot calculations place the first major support near $58,061, while Fibonacci-based calculations put support between roughly $58,982 and $56,814.
This creates a relatively clear framework for the current BTC price forecast.
A successful defense of $62,000 could preserve the range and allow a recovery toward the mid-to-high $60,000s. A sustained breakdown, by contrast, would shift attention toward the upper-$50,000s.
The key issue is confirmation. A brief move through either side of the range would not necessarily establish a new trend, particularly in a market carrying elevated derivatives exposure.
Bitcoin is now entering a period where positioning, liquidity, and technical structure are closely aligned around a narrow set of price levels.
The market is not showing a clear bullish signal yet. Softer inflation has failed to generate a decisive rally, spot demand remains an important concern, and moving averages continue to sit above BTC. Meanwhile, elevated futures positioning means a sudden price move could trigger additional liquidation flows.
At the same time, the decline in supply profitability shows that a substantial portion of the market has already experienced meaningful stress. If stronger buyers step in around the current support, that repositioning could eventually help establish a firmer base.
For now, the $62,200-$62,600 zone remains the most important short-term reference. Holding it would keep the broader range intact and leave $65,000, followed by $66,000-$69,000, as potential resistance areas.
Losing it would change the structure and bring the high-$50,000s into view.
The current Bitcoin price prediction is therefore less about forecasting a specific target than identifying the levels that will confirm the next trend. Until BTC breaks decisively from this range with stronger spot participation, the market remains a high-leverage, low-conviction environment where the next major move could be driven as much by positioning as by fundamental demand.






Aerodrome has announced a significant enhancement to its platform, allowing users to execute transactions without the need to manage private keys. This development, shared by
Robert Kiyosaki connected his personal trajectory to his mentor’s predictions and to the future of Bitcoin and AI in a recent, highly symbolic post. The

Jane Street’s shift to private debt could reduce transparency, impacting market insights and potentially aiding its tech expansion ambitions. The post Jane Street in talks
Third Point’s rapid divestment signals a strategic shift towards a more concentrated, tech-focused portfolio amid volatile semiconductor markets. The post Third Point LLC offloads stake
