

These moves came following a breakout structure chart released by analyst Anglio on X.ANSEM’s short-term charts show stronger trading since the recent pullback from intraday highs near $0.22. Although the price is starting to lose momentum at recent highs, market flow is positive on this trading view chart. The coin will most likely see the previous breakout area or recent resistance as price targets.
ANSEM has finally broken out above long resistance levels, which had contained it for months. However, ANSEM did not retreat to its previous range but has been seen to pull back to the breakout region.
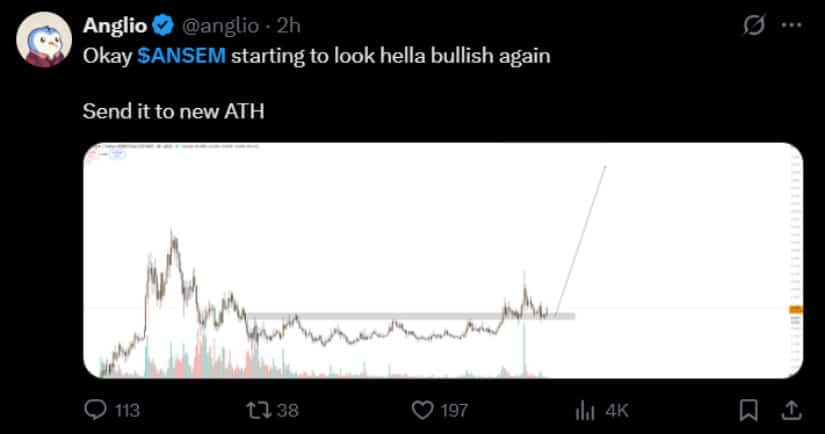
Anglio’s charts show this region to be the support after ANSEM’s breakout.Based on the price’s significant increase in price since the breakout, this can be seen to form another high on the trend. Source: Anglio via X
The current breakout zone also saw a high volume of transactions that occurred during the breakout session. The chart shows ANSEM starting to look very bullish for the future, and Anglio sees the potential for new all-time highs. The peak of ANSEM is $0.44, and the price currently sits at the 290th market rank.
Even so, BraveNewCoin’s recent chart shows ANSEM at $0.26, up 7.90% in 24 hours, with the price of ANSEM moving between $0.22 and $0.26. Trading volume for the period comes in at $16.90M, and market capitalization is $106.11M.
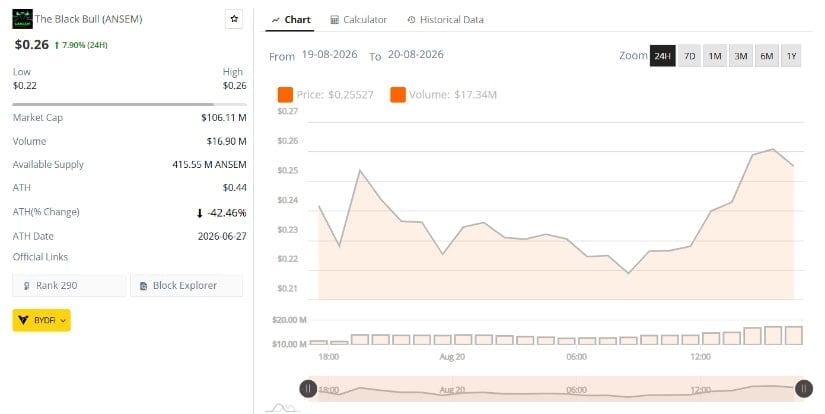 ANSEM’s total supply is currently at 415.55 million tokens, which is around 42.46% from its previous all-time high of $0.44 on June 27, 2026, while its market rank is at the 290th position. Source: BraveNewCoin
Recent data has set the market movement into two phases on the 24-hour price chart. A selling spree occurred from $0.24 to the $0.22 mark before the price was bought back at midday to push the price of ANSEM into the $0.26 region.
Meanwhile, TradingView shows buying pressure for ANSEM in recent times. A reading of 0.29 for Chaikin Money Flow from TradingView’s chart for ANSEM suggests buyers are taking control of the market.
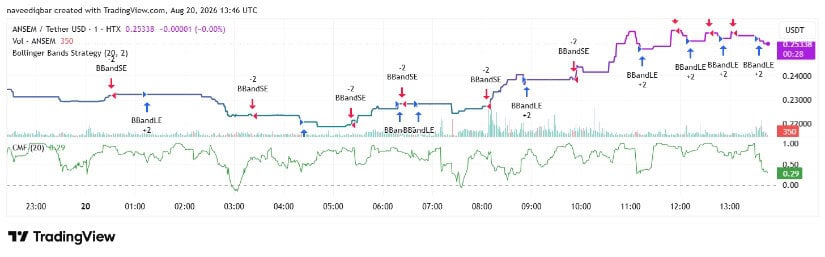 ANSEM price has maintained its upward journey following a correction from the $0.22 area and broke into the $0.24 mark at midday to move into the $0.25-$0.26 regions. Source: TradingView
The short, sharp bursts we’ve seen in hourly trends are stair steps in price that have brought the token to new price levels since the morning. There are stronger volume bars as well that accompanied the late-day push into the day’s highest price ranges.
Buying pressure on the chart has been reduced to 0.29 from a higher reading, but the price is still above $0.25. This would position immediate support at $0.25, and the previous breakout level at $0.24.






Three days in August did more for sentiment than the previous three months. ChatGPT AI predicts that the shift holds, and the price prediction places

AftermathFi has launched Perpetuals V2, enhancing its derivatives offerings and opening 15 new trading markets. The platform features a rebuilt perpetuals engine and has undergone
Superfinanciera, Colombia’s financial regulator, has issued a strong warning against unauthorized foreign investment offers. The agency stressed that only entities authorized by them can promote
CME Group Chairman Terry Duffy and Kalshi co-founder Luana Lopes Lara traded barbs during a CFTC meeting over prediction markets, manipulation, and regulatory standards.

