



The common signal is bullish when the price is above the previous resistance level, the buyers react fast to a shallow price decline, and the moving averages are below the price level. The distinction is in terms of time.
James Stanley identifies the nearest pullback levels; Maynard Inversiones identifies momentum and moving-average support; and MCO Global identifies the advance as part of a larger Elliott Wave structure.
Stanley’s chart does not depict one spiking advance but rather a stair-step advance. Gold cleared the 4,379–4,400 area, paused near $4,450, then pushed through $4,500 and $4,550.
The buyers returned to the tune of $4,600, where a quick glance was sufficient to move the price back to its highs of $4,650.
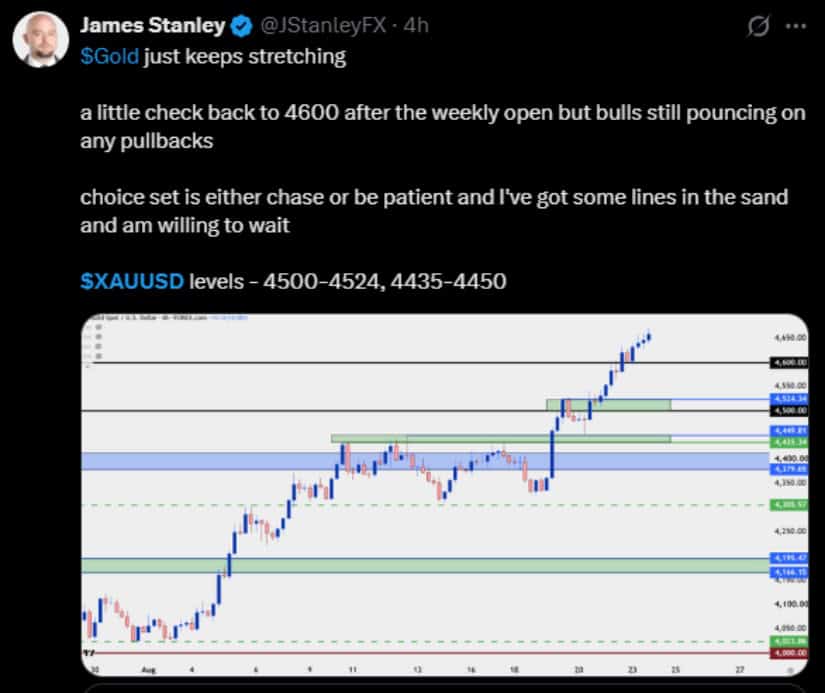 The sequence has been indicative of strong demand, but the rapidly rising slope also increases the chances of a more significant reset. Source: James Stanley Via X
The new first usable signal now reads $4,600. This would maintain the breakout of the bottom and would continue to exert pressure on the tops. The 4,500-4,524 demand zone would be in view with a deeper retreat. The second support band from 4,435-4,450 has more support due to the previous consolidation ceiling. The bull market rally would be called into question if the close turns below $4,435, bringing in the $4,379-4,400 breakout zone.
The chart for Maynard Inversiones is bullish as well. Gold is making a move above a scheme of moving averages and also a descending trendline that had held back earlier recovery moves.
Those averages are now above price, indicating that momentum in both the short-, medium-, and longer-term averages is all on the same page. The uptrend in the most recent leg is more credible.
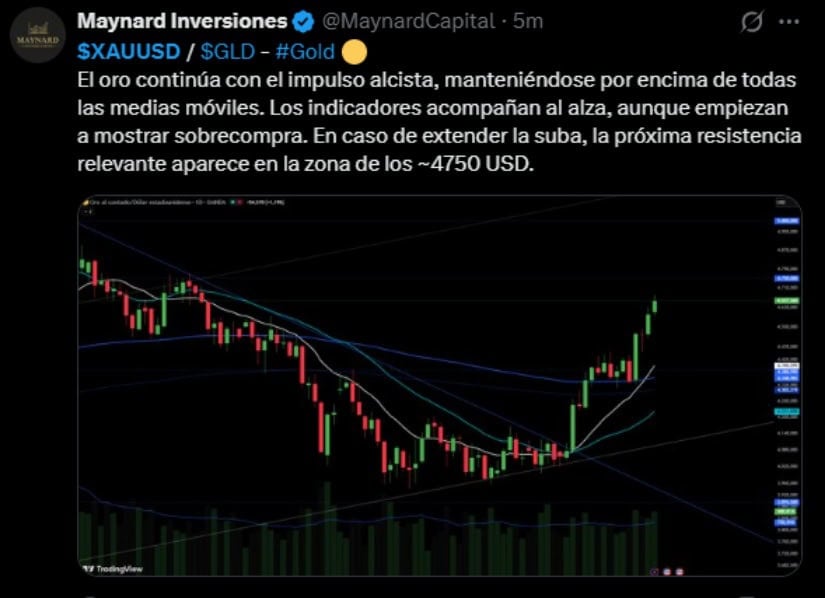 The Maynard chart shows strength will be maintained at the same rate. Momentum is indicating overbought conditions, and price has established a clearly visible oversold gap below its quicker-moving averages. Source: Maynard Inversiones Via X
An overbought situation is not necessarily a bearish reversal, particularly when in a strong trend. There is a caveat associated with this: people chasing near the highs will take on a lower risk/return than those waiting near support. The chart shows that if gold sustains closes above $4,650, the next resistance area will be around $4,750.
The longer time frame chart provided by MCO Global puts the short time frame levels in perspective. It has been treated as a fourth wave pullback in the Elliott Wave count by the Elliott Wave Trader. The Elliott Wave Trader count has treated the correction into the broad 3,328–4,377 range as a fourth wave pullback.
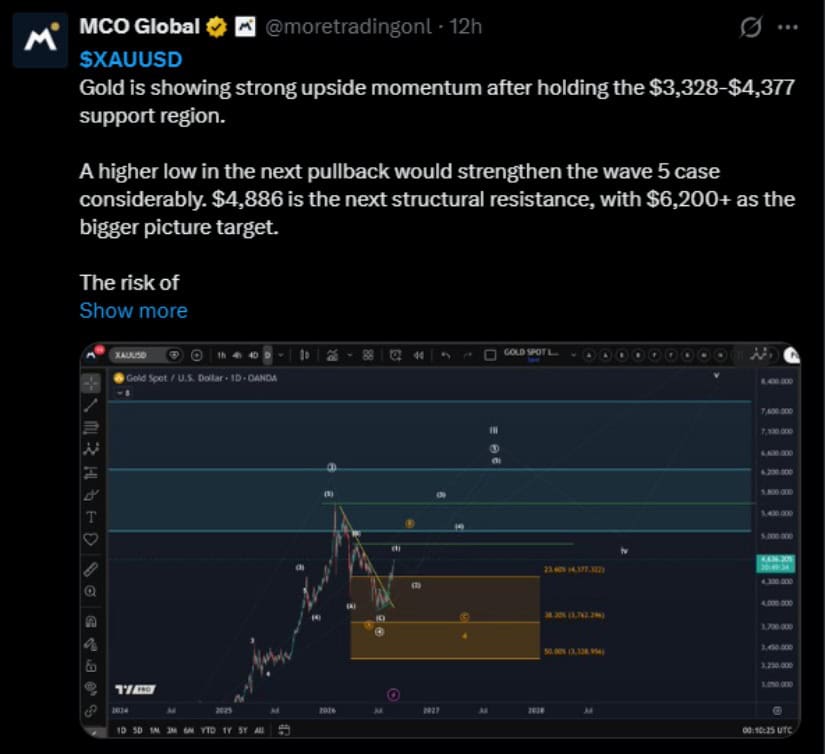 The 23.6% retracement near $4,377 is very similar to Stanley’s former resistance area, providing two time-frame technical significances. Source: MCO Global Via X
The bullish wave-five case requires gold to break a lower low in its next significant pullback. A move above $4,377 would confirm that suggestion, while a pullback below would add to the downward momentum to the 38.2% retracement around $3,742. On the bright side, MCO is the next big structural barrier at $4,886. The $6,200-plus forecast is long-range, and a breakout is first needed at $4,750 and $4,886 before it can be confirmed on a weekly close.
For the near term, a firm break above $4,650 would favor $4,750, followed by $4,886. Rejection near current levels would shift attention to $4,600, then 4,500–4,524 and 4,435–4,450. Those support tests will be used to determine if the buyer is still in control of the trend or if the rally has “gone too far.”






A recent transfer of 49,000 ETH, valued at approximately $121.9 million, has raised eyebrows among traders. The transaction, reported by Whale Alert, occurred between two

Enhanced UI performance on older devices could boost enterprise adoption, but model accuracy remains crucial for sustained user trust. The post Anthropic upgrades Claude’s streaming

Bitwise Chief Investment Officer Matt Hougan finds crypto’s bullish case easier to make in 2026 than during earlier cycles. His outlook reflects structural changes he
Whale Alert has confirmed a significant transfer of 659 BTC from Coinbase Institutional to an unknown wallet. This action, valued at approximately $52,042,730, could signal
