


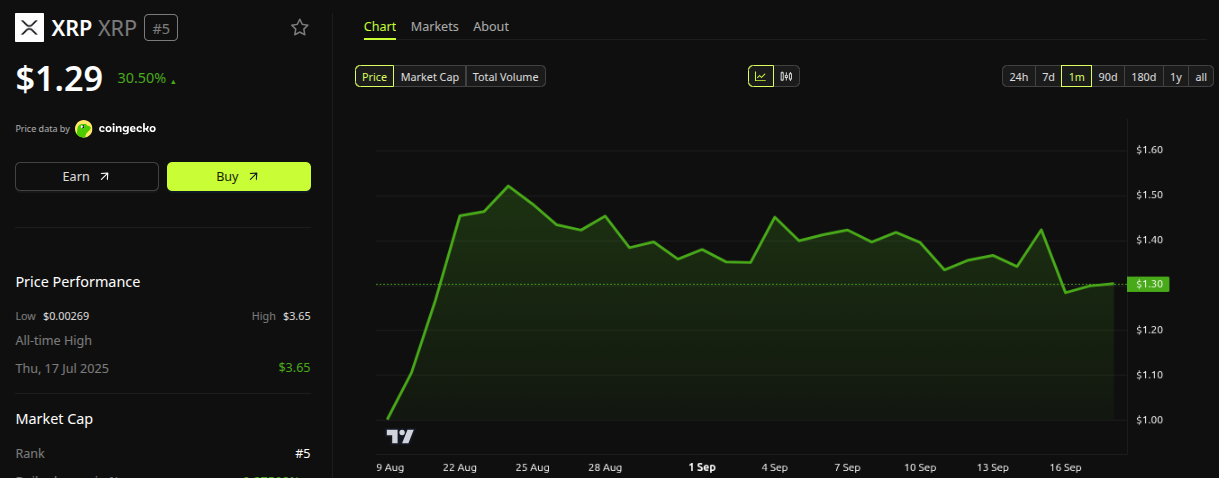
XRP trades near $1.29 after a sharp correction pushed its two-week Relative Strength Index to the lowest level in the token’s 13-year trading history.
That extreme reading has sparked fresh debate over whether XRP has finally found its cycle bottom.
Analyst Cryptollica highlighted the milestone in a widely shared post, noting the current two-week RSI near 33.5 has now dropped below the lows seen during the 2018 bear market, the 2020 COVID crash, and the 2022 crypto winter.
The accompanying chart shows XRP still sitting inside a long-term rising channel that has guided the asset through multiple cycles. Price currently rests near that structure’s lower boundary, an area that has historically provided strong support.
Follow us on X to get the latest news as it happens.
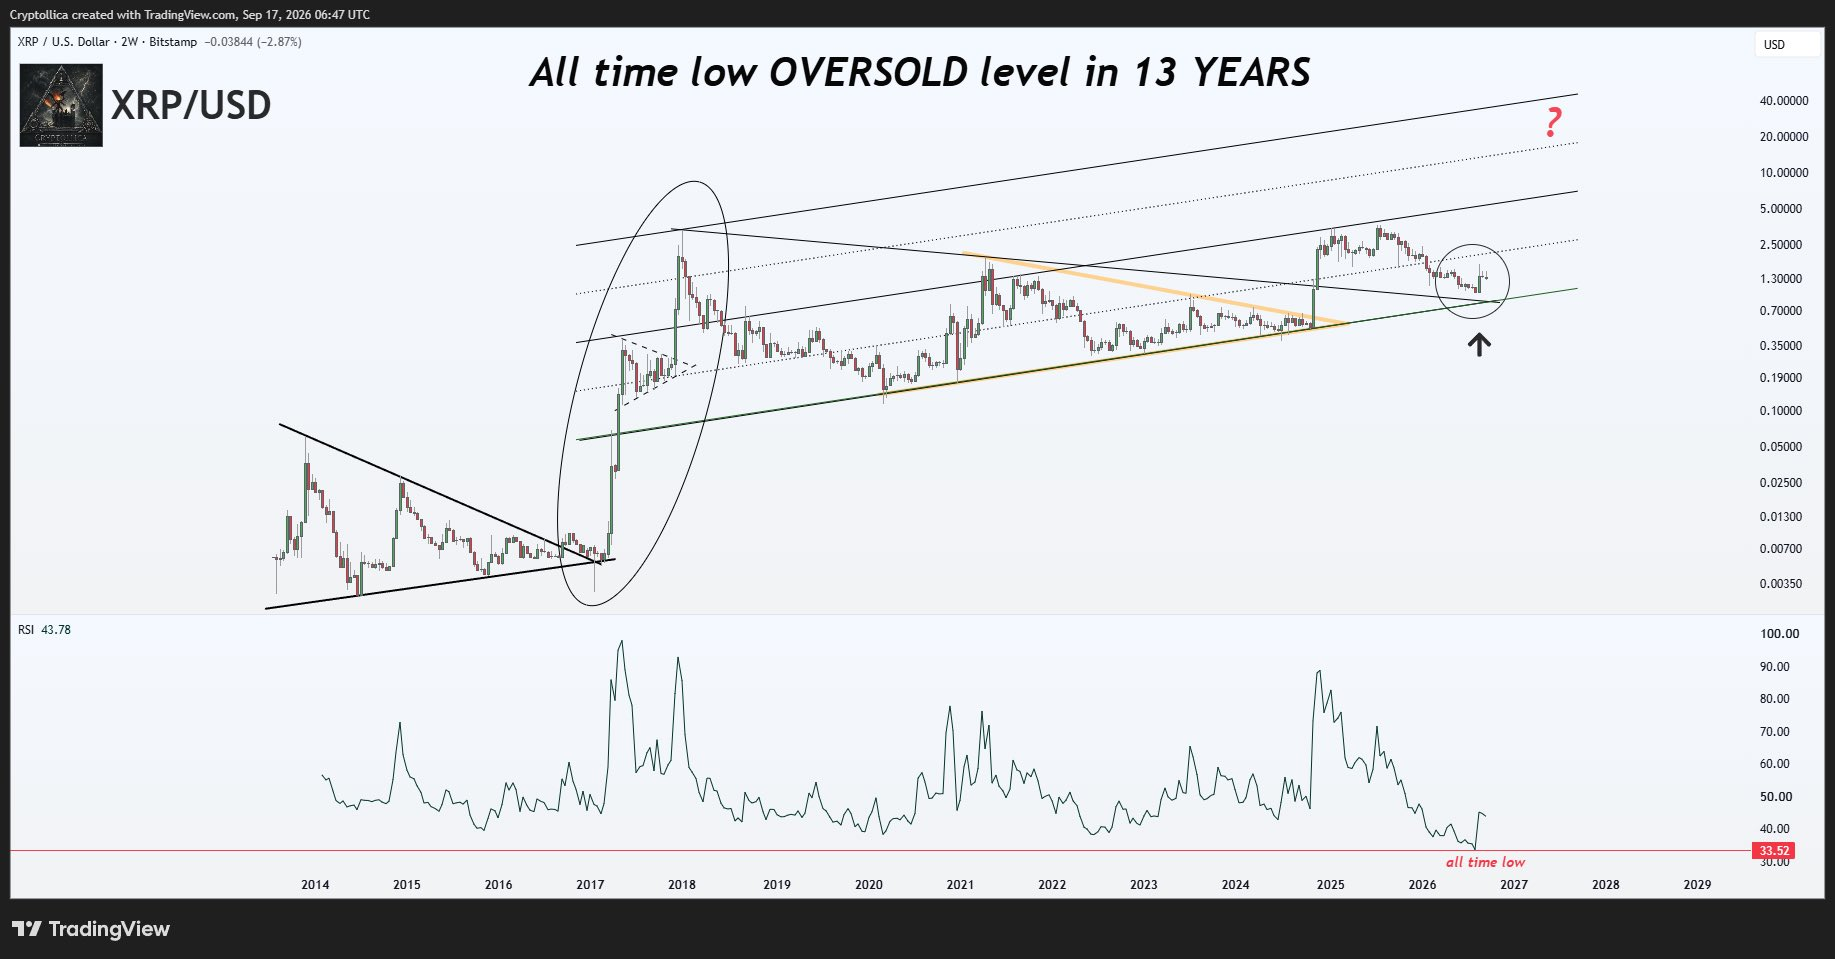
The analyst argued the market may be misreading the moment entirely. Sentiment has collapsed, and short-term price action looks broken, yet the higher-timeframe trendline has not failed. The analyst wrote that almost nobody wants XRP when its chart looks this damaged, even though such extremes have often preceded major rallies.
EGRAG Crypto added supporting evidence, noting that XRP’s two-month RSI has re-entered a historical zone associated with prior bottoming processes, arguing that cycle behavior matters more than the exact number.
Not everyone agrees a bottom is confirmed. Technical analyst ChartNerd noted XRP remains compressed between the 20-week EMA near $1.29 and the 50-week EMA resistance around $1.52.
A sustained weekly close below $1.29, ChartNerd warned, could open a path toward the $1.00 psychological level. Lower highs and lower lows still appear on intermediate timeframes, suggesting continued consolidation rather than a confirmed reversal.
“Similar to failed closes above the 50 week EMA since the rise to $1.70, If $XRP witnesses daily/weekly closes below $1.29, the next support is back at $1.00. That’s how important the 20 week EMA retest that we just printed is. It has to hold or we dive,” ChartNerd said on X.
CrediBULL Crypto offered a more constructive view, pointing to a related bottom-zone setup in which relative strength has already begun to improve from recent lows.
XRP now sits at a genuine technical inflection point. The record-low RSI, an intact multi-year structure, and heavy negative sentiment together create one of the more debated risk-reward setups in the current market.
Subscribe to our YouTube channel to watch leaders and journalists provide expert insights.
Whether this reading marks a true cycle low or just another stage in a longer bottoming process depends on price action ahead. Holding the long-term structure would strengthen the bottom case, while a decisive break below $1.29 would shift focus to deeper support.
The post This XRP Chart Signal Hasn’t Happened in 13 Years appeared first on BeInCrypto.






CleanSpark’s bond strategy highlights a shift in data center financing, emphasizing the growing importance of AI infrastructure investments. The post CleanSpark seeks $2.2B through junk-bond
The sanctions on Iranian crypto exchanges could destabilize global crypto liquidity and heighten compliance risks for international platforms. The post US sanctions Iranian crypto exchanges
Tokenization’s growth hinges on attracting traditional investors, enhancing market liquidity and fostering broader institutional adoption. The post Securitize CEO Carlos Domingo says tokenization won’t go
Bitcoin faced renewed volatility on Thursday after stronger-than-expected U.S. labor data fueled speculation that the Federal Reserve could maintain its hawkish stance following its latest
