

Traders are gearing up for the Federal Reserve decision, and the gold price is coming back to a key technical area. The configurations suggest a market that is searching for confirmation and not a directional break in the market.
Ian Cooper, an analyst, says gold is back in a marked consolidation zone and is up some 1.2%. He has seen price pushback from a breakdown, and his daily chart suggests the price move will be reversed.
The yellow box is around the $4,300 figure, and it has provided support and resistance. The gold price dipped briefly below the area, but the buyers made a comeback, pushing the price back inside the area. That recovery is sufficient to keep the short-term structure neutral and not signal further downside.
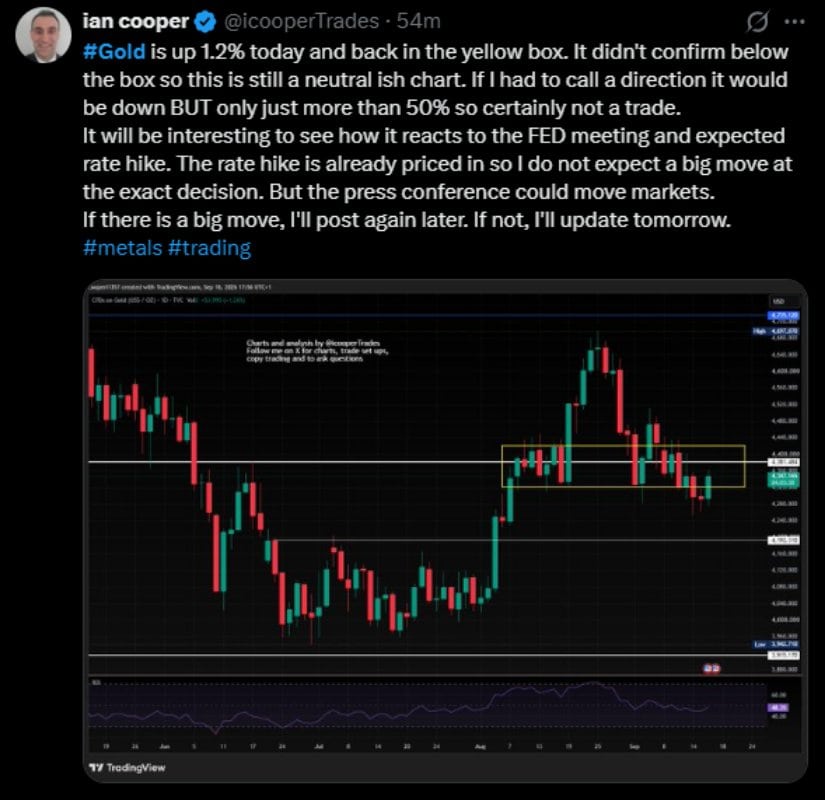 The chart isn’t giving a clear direction signal, Cooper says. Price must gain technical strength in the recovery if it is to cross above the range. Yet another rejection may simply extend the consolidation of gold. Source: Cooper via X
His chart is also fairly balanced with regard to momentum. The RSI is near the midrange, indicating that neither buyers nor sellers are dominating the market. That means the Fed decision and its remarks are the only potential catalysts for a breakout.
Gold is trading close to the top of a downtrend upper trending wedge, according to James Stanley’s chart. The pattern has been established since the price backed off from its highs of late August and set lower highs in September.
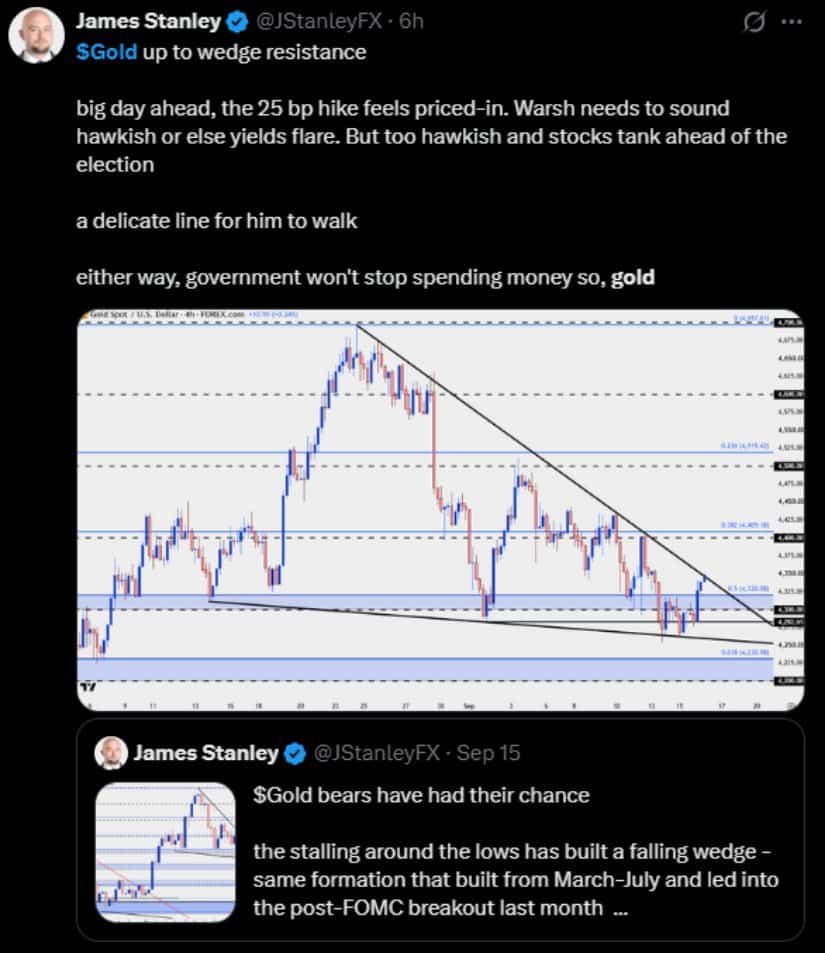 Gold has been making a strong defense on the bottom half of the structure near the $4250–$4300 level. Source: James via X
Gold has been holding the lower half of the structure at the $4250–$4300 level repeatedly. Buyers have now brought the price back towards the downtrend line. A clean move above that level would put an end to the pattern that has been continuing to drive price down.
It is critical to note that a significant Fibonacci level is located close to $4,400 on the chart. Purchasing the recovery would find another resistance at $4,500. In addition, the high temperatures of the end of August would become important again.
The wedge, however, hasn’t proved a breakout. Gold continues to hold onto the lower resistance level; there is still a chance for a rejection. The $4,300 area remains significant support, and a further drop may reintroduce support at the $4,200 level.
Money supply is also the primary threat in the near-term, Stanley added. Much of the expected rate move is already reflected in markets. That could lead to greater reactions in bond yields and the dollar to guidance, rather than the decision.
Another chart from Uselink Commodity Charts provides an intermarket signal. The silver-to-gold ratio is approaching its resistance line from the 2026 level for the 3rd time.
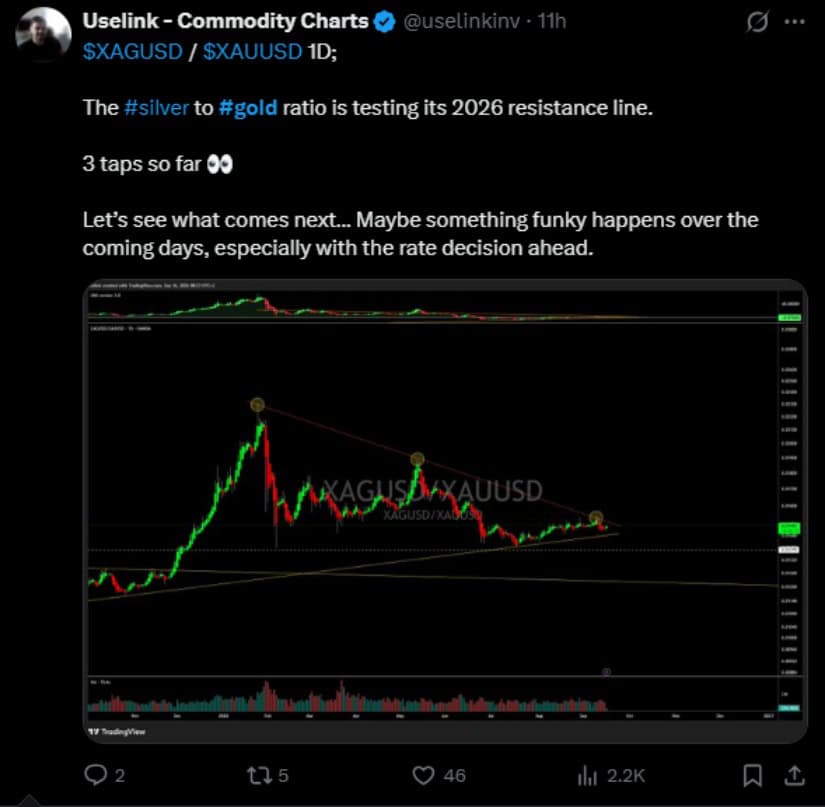 The ratio has been making lower peaks since early 2026 and continues to have an ascending longer-term support line. Source: Uselink Via X
This formation forms a contraction zone between the downtrend resistance and the uptrend support.
If the ratio breaks out, that will be a sign that silver is performing better than gold. If they are rejected, it would indicate that gold has taken on relative strength against silver. The setup doesn’t directly impact the dollar price of gold, but it does help monitor the shift of capital from gold to other precious metals.
With regard to gold, the primary technical issue remains with the falling wedge. Price is moving upwards from the recent lows and making headway towards resistance that is formed in a downward trend. The $4,400 and $4,500 levels are on the horizon if it is a confirmed break.
If gold fails to break the trendline, it will remain in its September range. Traders will therefore be closely monitoring the $4,300-$4,400 area, as well as the Fed decision and bond yields.







