


Bitcoin price started a downside correction from the $78,000 zone. BTC is consolidating and might aim for a fresh increase if it clears $78,000.
Bitcoin price failed to clear the $78,000 resistance zone. BTC started a downside correction from the $77,809 swing high and traded below $77,500.
There was a move below the 23.6% Fib retracement level of the upward move from the $74,209 swing low to the $77,809 high. Besides, there was a break below a contracting triangle with support at $76,750 on the hourly chart of the BTC/USD pair.
However, the bulls are active above $76,000. Bitcoin is now trading below $77,000 and the 100 hourly simple moving average. If the price remains stable above $76,000, it could attempt a fresh increase. Immediate resistance is near the $76,750 level.
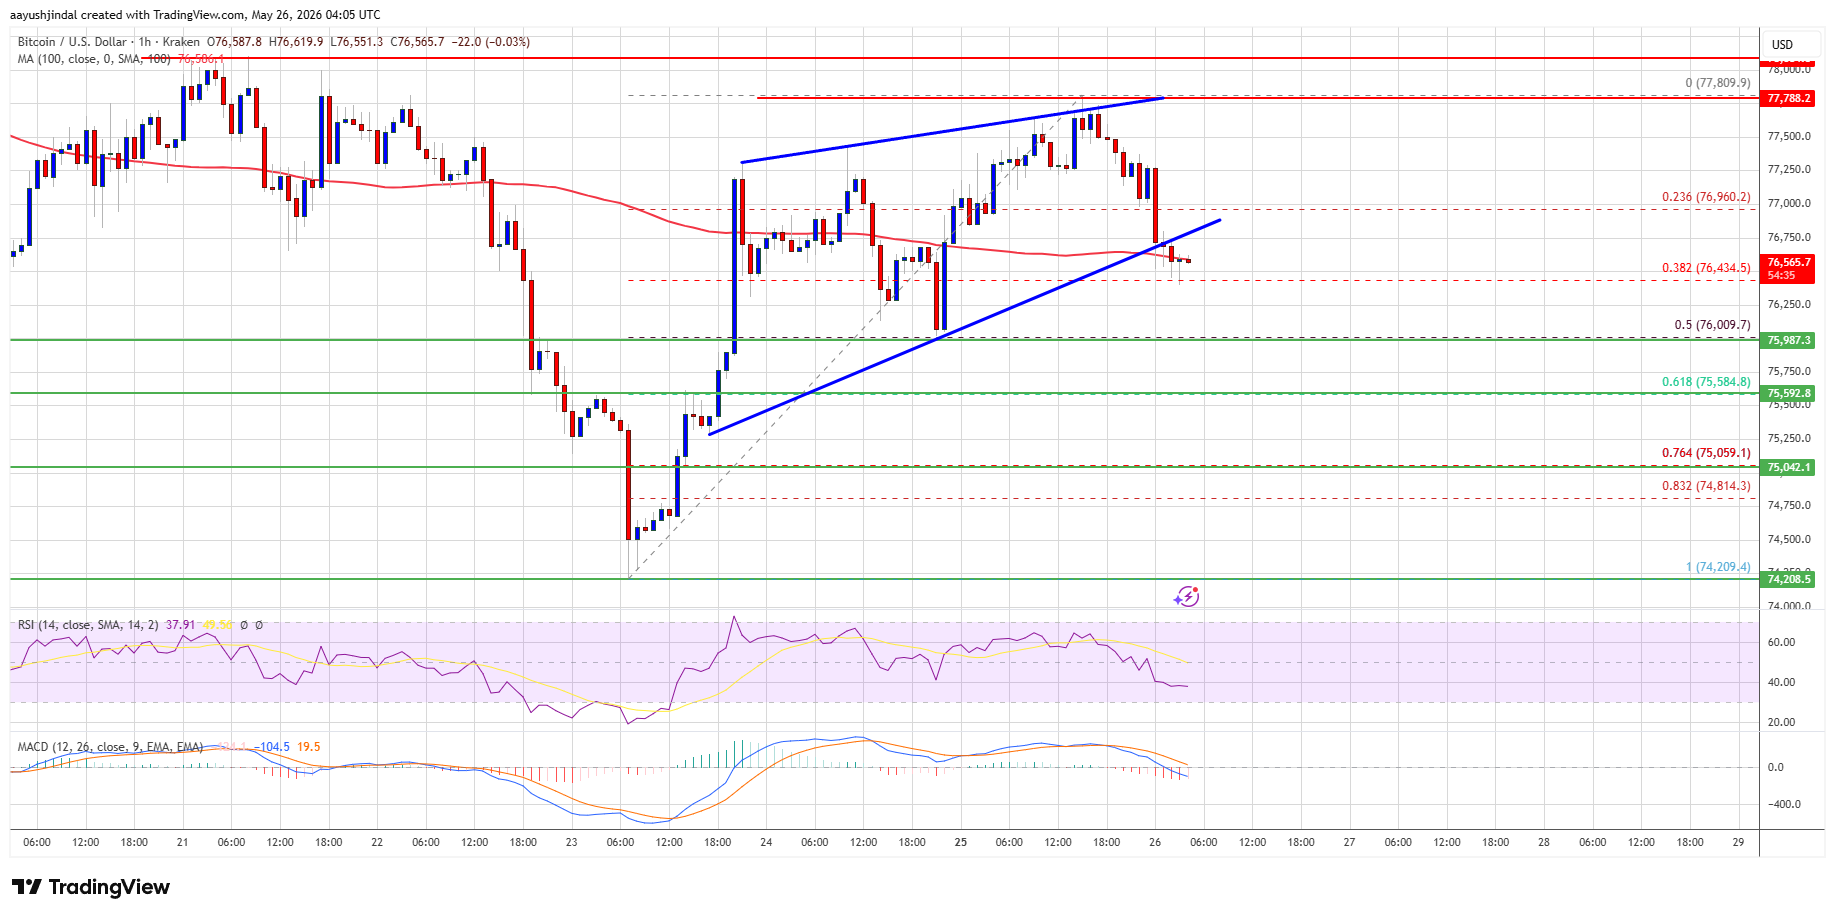
The first key resistance is near the $77,200 level. A close above the $77,200 resistance might send the price further higher. In the stated case, the price could rise and test the $77,800 resistance. Any more gains might send the price toward the $78,000 level. The next barrier for the bulls could be $79,500.
If Bitcoin fails to rise above the $77,200 resistance zone, it could start another decline. Immediate support is near the $76,000 level or the 50% Fib retracement level of the upward move from the $74,209 swing low to the $77,809 high.
The first major support is near the $75,500 level. The next support is now near the $75,000 zone. Any more losses might send the price toward the $74,000 support in the near term. The main support now sits at $73,500, below which BTC might struggle to recover in the near term.
Technical indicators:
Hourly MACD – The MACD is now gaining pace in the bearish zone.
Hourly RSI (Relative Strength Index) – The RSI for BTC/USD is now below the 50 level.
Major Support Levels – $76,000, followed by $75,000.
Major Resistance Levels – $77,200 and $78,000.







China’s rate cut may boost risk assets and digital markets, but sustained easing could reveal deeper economic challenges ahead. The post China cuts one-year policy
The potential Iran deal highlights the complex interplay between military actions and diplomatic negotiations, impacting global energy and crypto markets. The post Marco Rubio says
The statements by Alla Bakina, Director of the Bank of Russia’s National Payment System Department, are supported by the low adoption of these cards in
Low Bitcoin volatility may signal a potential market shift, offering investors cheaper options and a chance to anticipate future trends. The post Bitcoin volatility falls
