
The rebound lifted Hedera from $0.0781 and briefly pushed the price above $0.082 before momentum weakened.
Meanwhile, the charts show that capital continued entering the market during the recovery. However, HBAR remains below several levels lost during the wider decline, leaving the token near an important resistance zone.
DaVinciGraph drew attention to HBAR after the token posted a strong 24-hour gain. CoinGecko data in the analyst’s update showed Hedera near $0.0815, up about 3.9% during the measured period.
The token later reached above $0.082 before losing part of its advance. Even so, the intraday chart maintained a series of higher lows, showing stronger demand after the earlier decline.
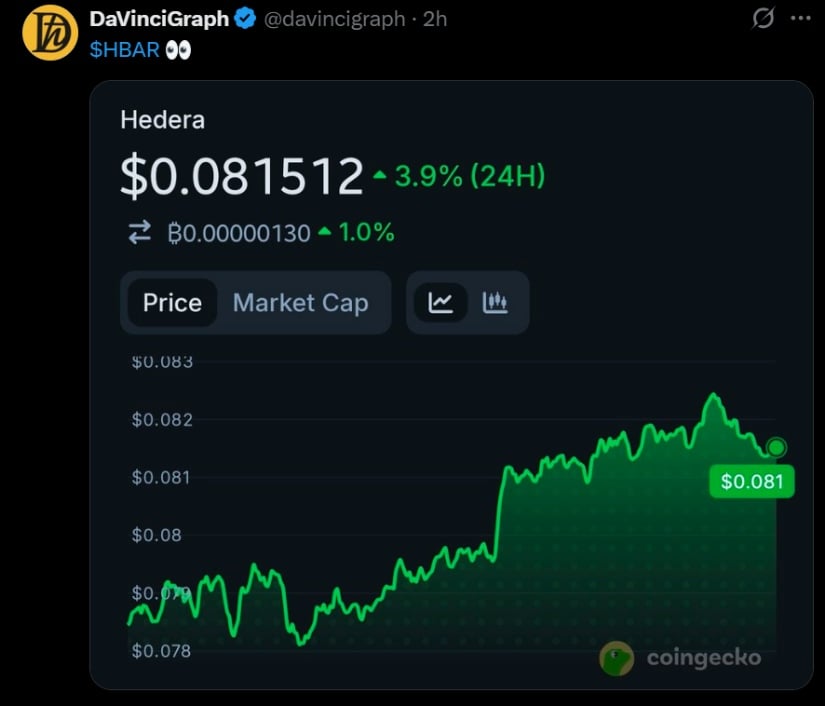
According to the analyst chart, the price initially traded below $0.079 before building a steady recovery. Buyers then pushed HBAR through $0.080, followed by a sharper move toward the $0.081 area.
Volume also increased around the recovery from the June 6 low. That activity supported the move toward $0.082, although trading slowed after HBAR entered a tighter range.
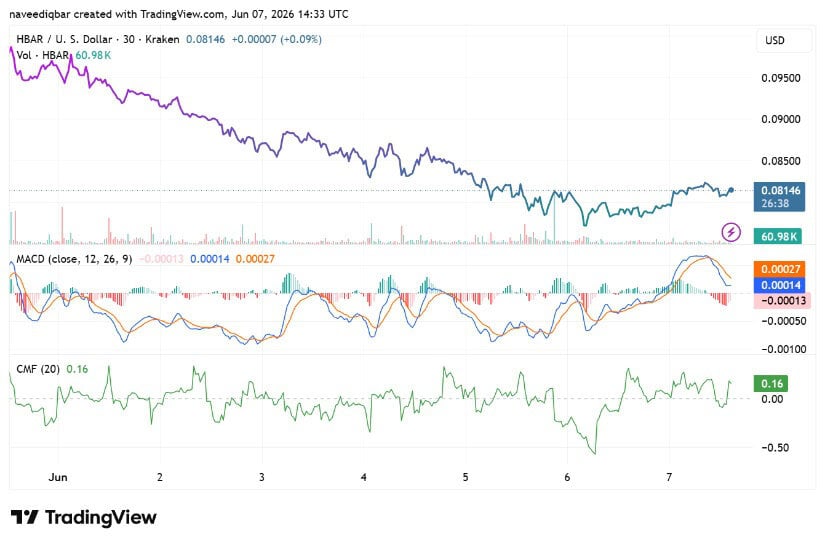
TradingView showed HBAR near $0.08146 at the time of writing. The 30-minute chart revealed a broader decline from above $0.095 at the start of June, followed by stabilization near $0.078.
Notably, the Chaikin Money Flow indicator reached 0.16. A reading above zero shows that buying pressure exceeded selling pressure during the measured period.
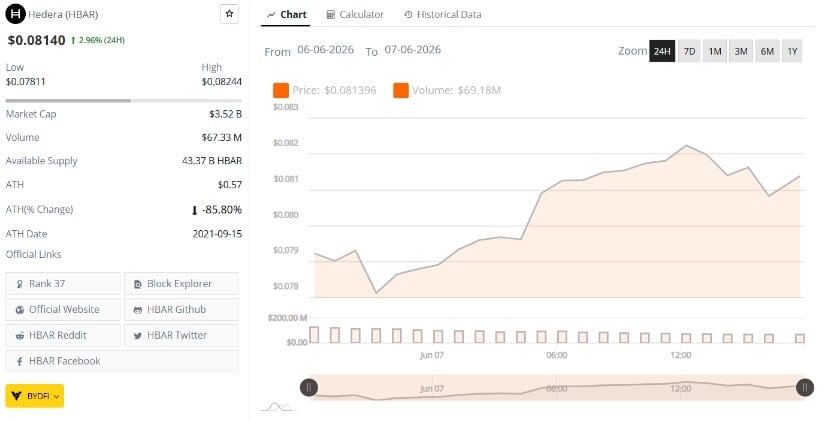
Meanwhile, BraveNewCoin data placed HBAR at $0.0814, up 2.96% over 24 hours. The token traded between $0.07811 and $0.08244, while daily volume stood near $67.33 million.
Hedera’s market capitalization stood near $3.52 billion, with about 43.37 billion HBAR in circulation. The token remained roughly 85.8% below its September 2021 record of $0.57.
Although capital flow remained positive, MACD showed that the rebound was losing strength. The MACD line stood at 0.00014, below the signal line at 0.00027.
Additionally, the histogram turned negative at -0.00013. This change indicates that short-term bullish momentum faded after the price approached the session’s upper range.
As per TradingView data, HBAR now faces resistance between $0.082 and $0.0825. Buyers failed to hold above this area during the latest advance, making it the first level required for a stronger continuation.
A sustained break above $0.0825 could place $0.085 back in focus. That level previously acted as support before the latest decline accelerated.
However, $0.080 remains the nearest support below current prices. A loss of that level would expose the $0.0781 daily low, where buyers began the latest recovery.


How is the SpaceX IPO influencing Bitcoin and crypto? Discover the shifts in trader sentiment and market dynamics. The post SpaceX and Mega IPOs Fuel
Researchers have spent more than 15 years picking apart Satoshi Nakamoto’s emails, code commits, and PDF metadata, and what they found rarely surfaces in mainstream
There is a particular kind of comeback the United States can’t resist: the public figure who was written off, who stops apologizing, and who simply
The 60-day deadline pressures both U.S. and Iran, impacting geopolitical stability, oil prices, and market dynamics, especially in crypto. The post Trump sets 60-day deadline