
The rebound lifted Hedera from $0.0781 and briefly pushed the price above $0.082 before momentum weakened.
Meanwhile, the charts show that capital continued entering the market during the recovery. However, HBAR remains below several levels lost during the wider decline, leaving the token near an important resistance zone.
DaVinciGraph drew attention to HBAR after the token posted a strong 24-hour gain. CoinGecko data in the analyst’s update showed Hedera near $0.0815, up about 3.9% during the measured period.
The token later reached above $0.082 before losing part of its advance. Even so, the intraday chart maintained a series of higher lows, showing stronger demand after the earlier decline.
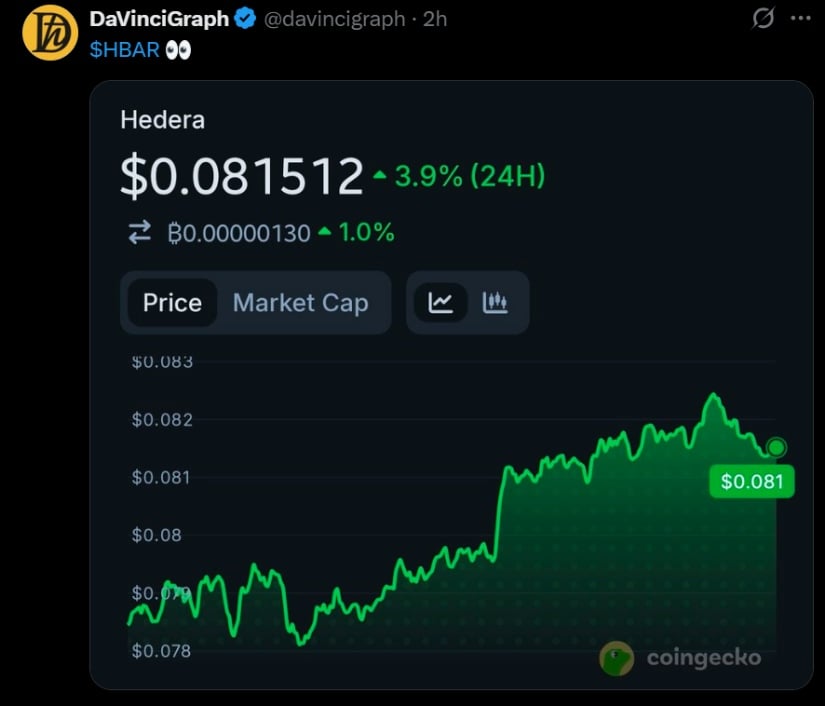
According to the analyst chart, the price initially traded below $0.079 before building a steady recovery. Buyers then pushed HBAR through $0.080, followed by a sharper move toward the $0.081 area.
Volume also increased around the recovery from the June 6 low. That activity supported the move toward $0.082, although trading slowed after HBAR entered a tighter range.
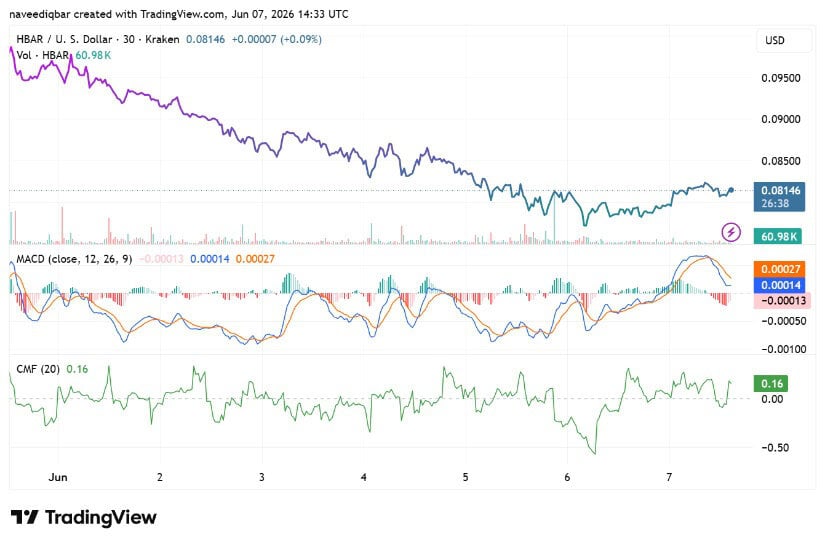
TradingView showed HBAR near $0.08146 at the time of writing. The 30-minute chart revealed a broader decline from above $0.095 at the start of June, followed by stabilization near $0.078.
Notably, the Chaikin Money Flow indicator reached 0.16. A reading above zero shows that buying pressure exceeded selling pressure during the measured period.
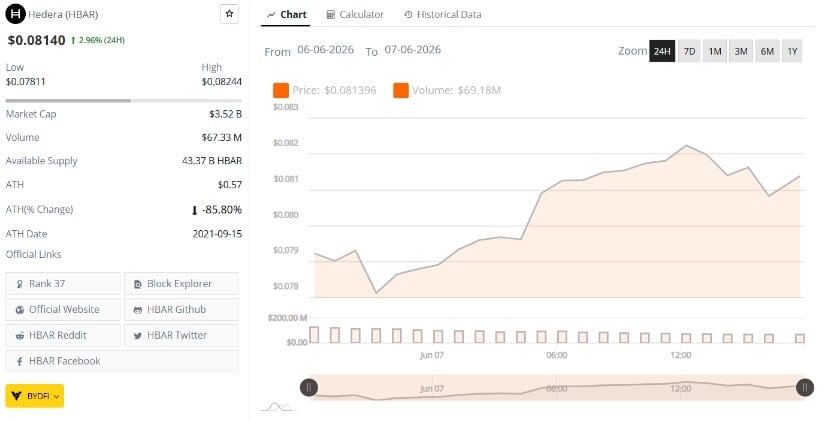
Meanwhile, BraveNewCoin data placed HBAR at $0.0814, up 2.96% over 24 hours. The token traded between $0.07811 and $0.08244, while daily volume stood near $67.33 million.
Hedera’s market capitalization stood near $3.52 billion, with about 43.37 billion HBAR in circulation. The token remained roughly 85.8% below its September 2021 record of $0.57.
Although capital flow remained positive, MACD showed that the rebound was losing strength. The MACD line stood at 0.00014, below the signal line at 0.00027.
Additionally, the histogram turned negative at -0.00013. This change indicates that short-term bullish momentum faded after the price approached the session’s upper range.
As per TradingView data, HBAR now faces resistance between $0.082 and $0.0825. Buyers failed to hold above this area during the latest advance, making it the first level required for a stronger continuation.
A sustained break above $0.0825 could place $0.085 back in focus. That level previously acted as support before the latest decline accelerated.
However, $0.080 remains the nearest support below current prices. A loss of that level would expose the $0.0781 daily low, where buyers began the latest recovery.


XRP price has touched a 15-week low, and the prediction setup heading into the next few sessions is anything but clean. The post XRP Price
A New York judge has paused a lawsuit that claims ownership of 39,069 dormant Bitcoin (BTC) wallets. The order blocks any quick victory for the
Reports indicate that some of the payments could have been made in stablecoins, particularly Tether’s USDT, the largest stablecoin by market capitalization. The U.S. OFAC
Escalating tensions in the Strait of Hormuz could destabilize global markets, influencing oil prices, crypto volatility, and regulatory landscapes. The post Iran launches multiple drones