

Data from X, BraveNewCoin, and TradingView point to $0.15 as the immediate resistance area, while $0.13 to $0.14 provides the nearest support zone.
A chart shared by HaxKai on X shows ANSEM trading near $0.1503 after losing the $0.175 area previously marked as support. The breakdown keeps the analyst’s bearish short setup active, with price still far below the major resistance zone around $0.465 to $0.470.
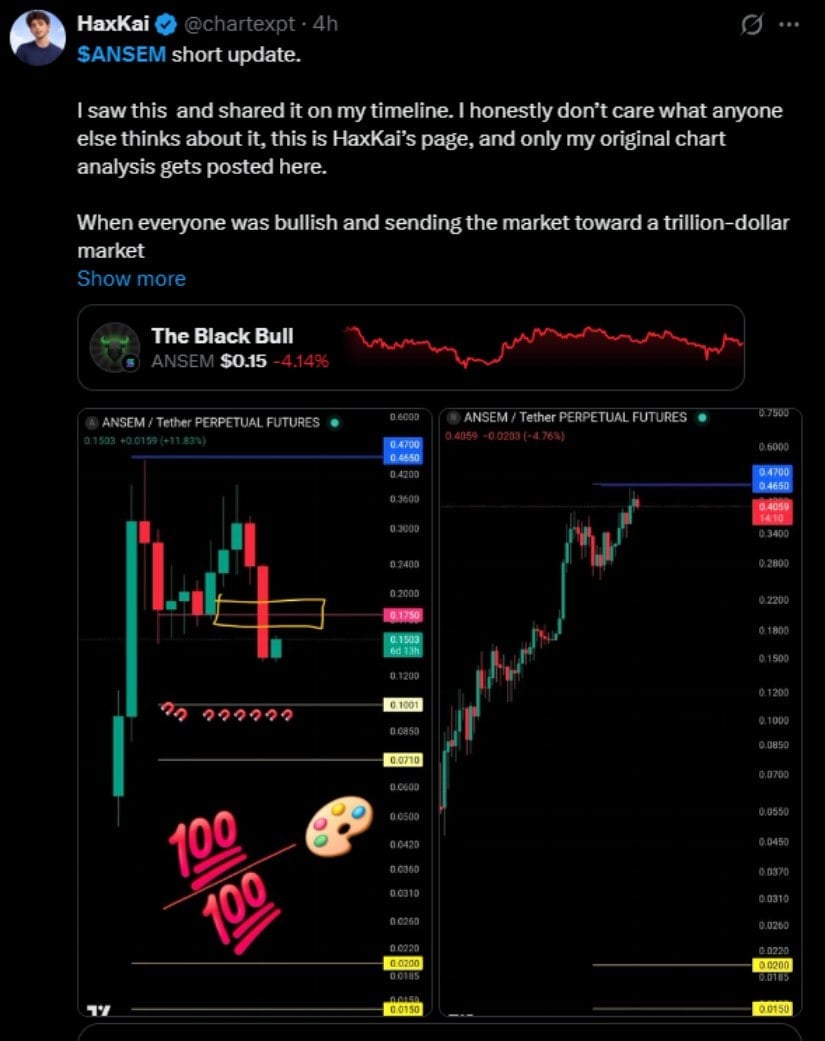 HaxKai’s chart marks $0.1001 as the first major downside level beneath current prices. Another support level appears near $0.0710, while deeper technical levels sit around $0.0200 and $0.0150. Source: HaxKai Via X
Those lower levels represent chart targets rather than confirmed future prices. However, ANSEM would need to reclaim $0.175 before challenging the broader bearish structure displayed by the analyst.
The comparison chart also shows how sharply ANSEM has fallen from the earlier $0.40 region. That decline leaves several previous price zones above current levels acting as potential resistance during any recovery.
Meanwhile, BraveNewCoin shows ANSEM at about $0.15, down 2.84% over 24 hours. Price traded between $0.13 and $0.15, showing considerable volatility within the session.
The 24-hour chart shows ANSEM dropping toward the low-$0.13 area before recovering sharply. The price later tested $0.15 several times but failed to establish a sustained move above that level.
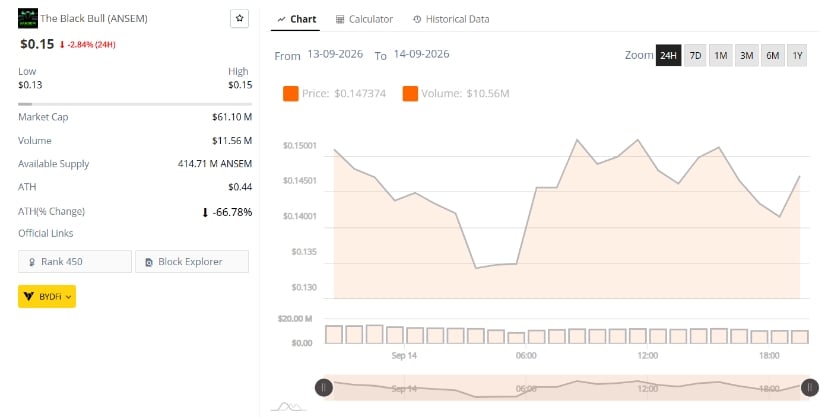 That makes $0.15 the clearest short-term resistance from the market data. Meanwhile, the $0.14 area provides initial support, followed by the 24-hour low around $0.13. Source: BraveNewCoin
Market data places ANSEM’s market capitalization near $61.10 million, with 24-hour trading volume around $11.56 million. Available supply stands at approximately 414.71 million ANSEM.
The token also trades about 66.78% below its $0.44 all-time high. Therefore, the latest rebound still sits well below the broader historical peak.
The TradingView chart provides a closer intraday view, with ANSEM trading near $0.1480. Price spent much of the session between roughly $0.14 and $0.15, repeatedly testing the upper boundary.
Notably, ANSEM experienced a sharp intraday drop below $0.14 before recovering. Buyers subsequently pushed price back toward $0.148, placing the token close to the session’s resistance zone again.
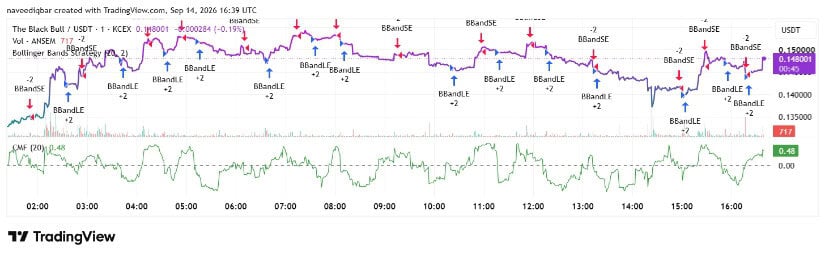 The chart’s Chaikin Money Flow sits near 0.48, well above the zero line. That reading shows positive money flow during the latest rebound, despite ANSEM remaining below $0.15. Source: TradingView
Multiple Bollinger Band strategy signals also appear throughout the session. They reflect frequent changes in short-term momentum as the price moved between support and resistance.
For the immediate setup, a sustained move above $0.15 would strengthen the recovery structure. Conversely, another rejection could return attention toward $0.145 and $0.14, followed by the broader $0.13 support area visible on market data.







