


Bitcoin is trading at its immediate support at $77,290, down 2.2% over the past 24 hours. Not an exciting price action, sure, but after a brutal August drawdown, it’s exactly the kind of stall that technicians get excited about. Two signals in particular are doing the rounds this week, and they’re worth unpacking before deciding whether this is a bottom or a bull trap.
Market analyst Will Clemente now puts the odds of a completed cycle bottom at 70–75%, pointing to an on-chain capitulation cluster paired with a drawdown structure that mirrors prior cycle lows.
Bitfinex on-chain data separately shows repeated buyer defense of the $76,000–$76,350 zone, the average cost basis of active investors, with each retest attracting fresh demand.
A completed volatility compression pattern is adding weight to the bottom thesis among traders watching realized volatility metrics.
Whether this holds depends on what happens at resistance overhead, and on whether institutional flows keep validating the floor. Both are testable in the days ahead.
Market Intelligence: Crypto Analyst Predicts Best New Crypto to Hodl
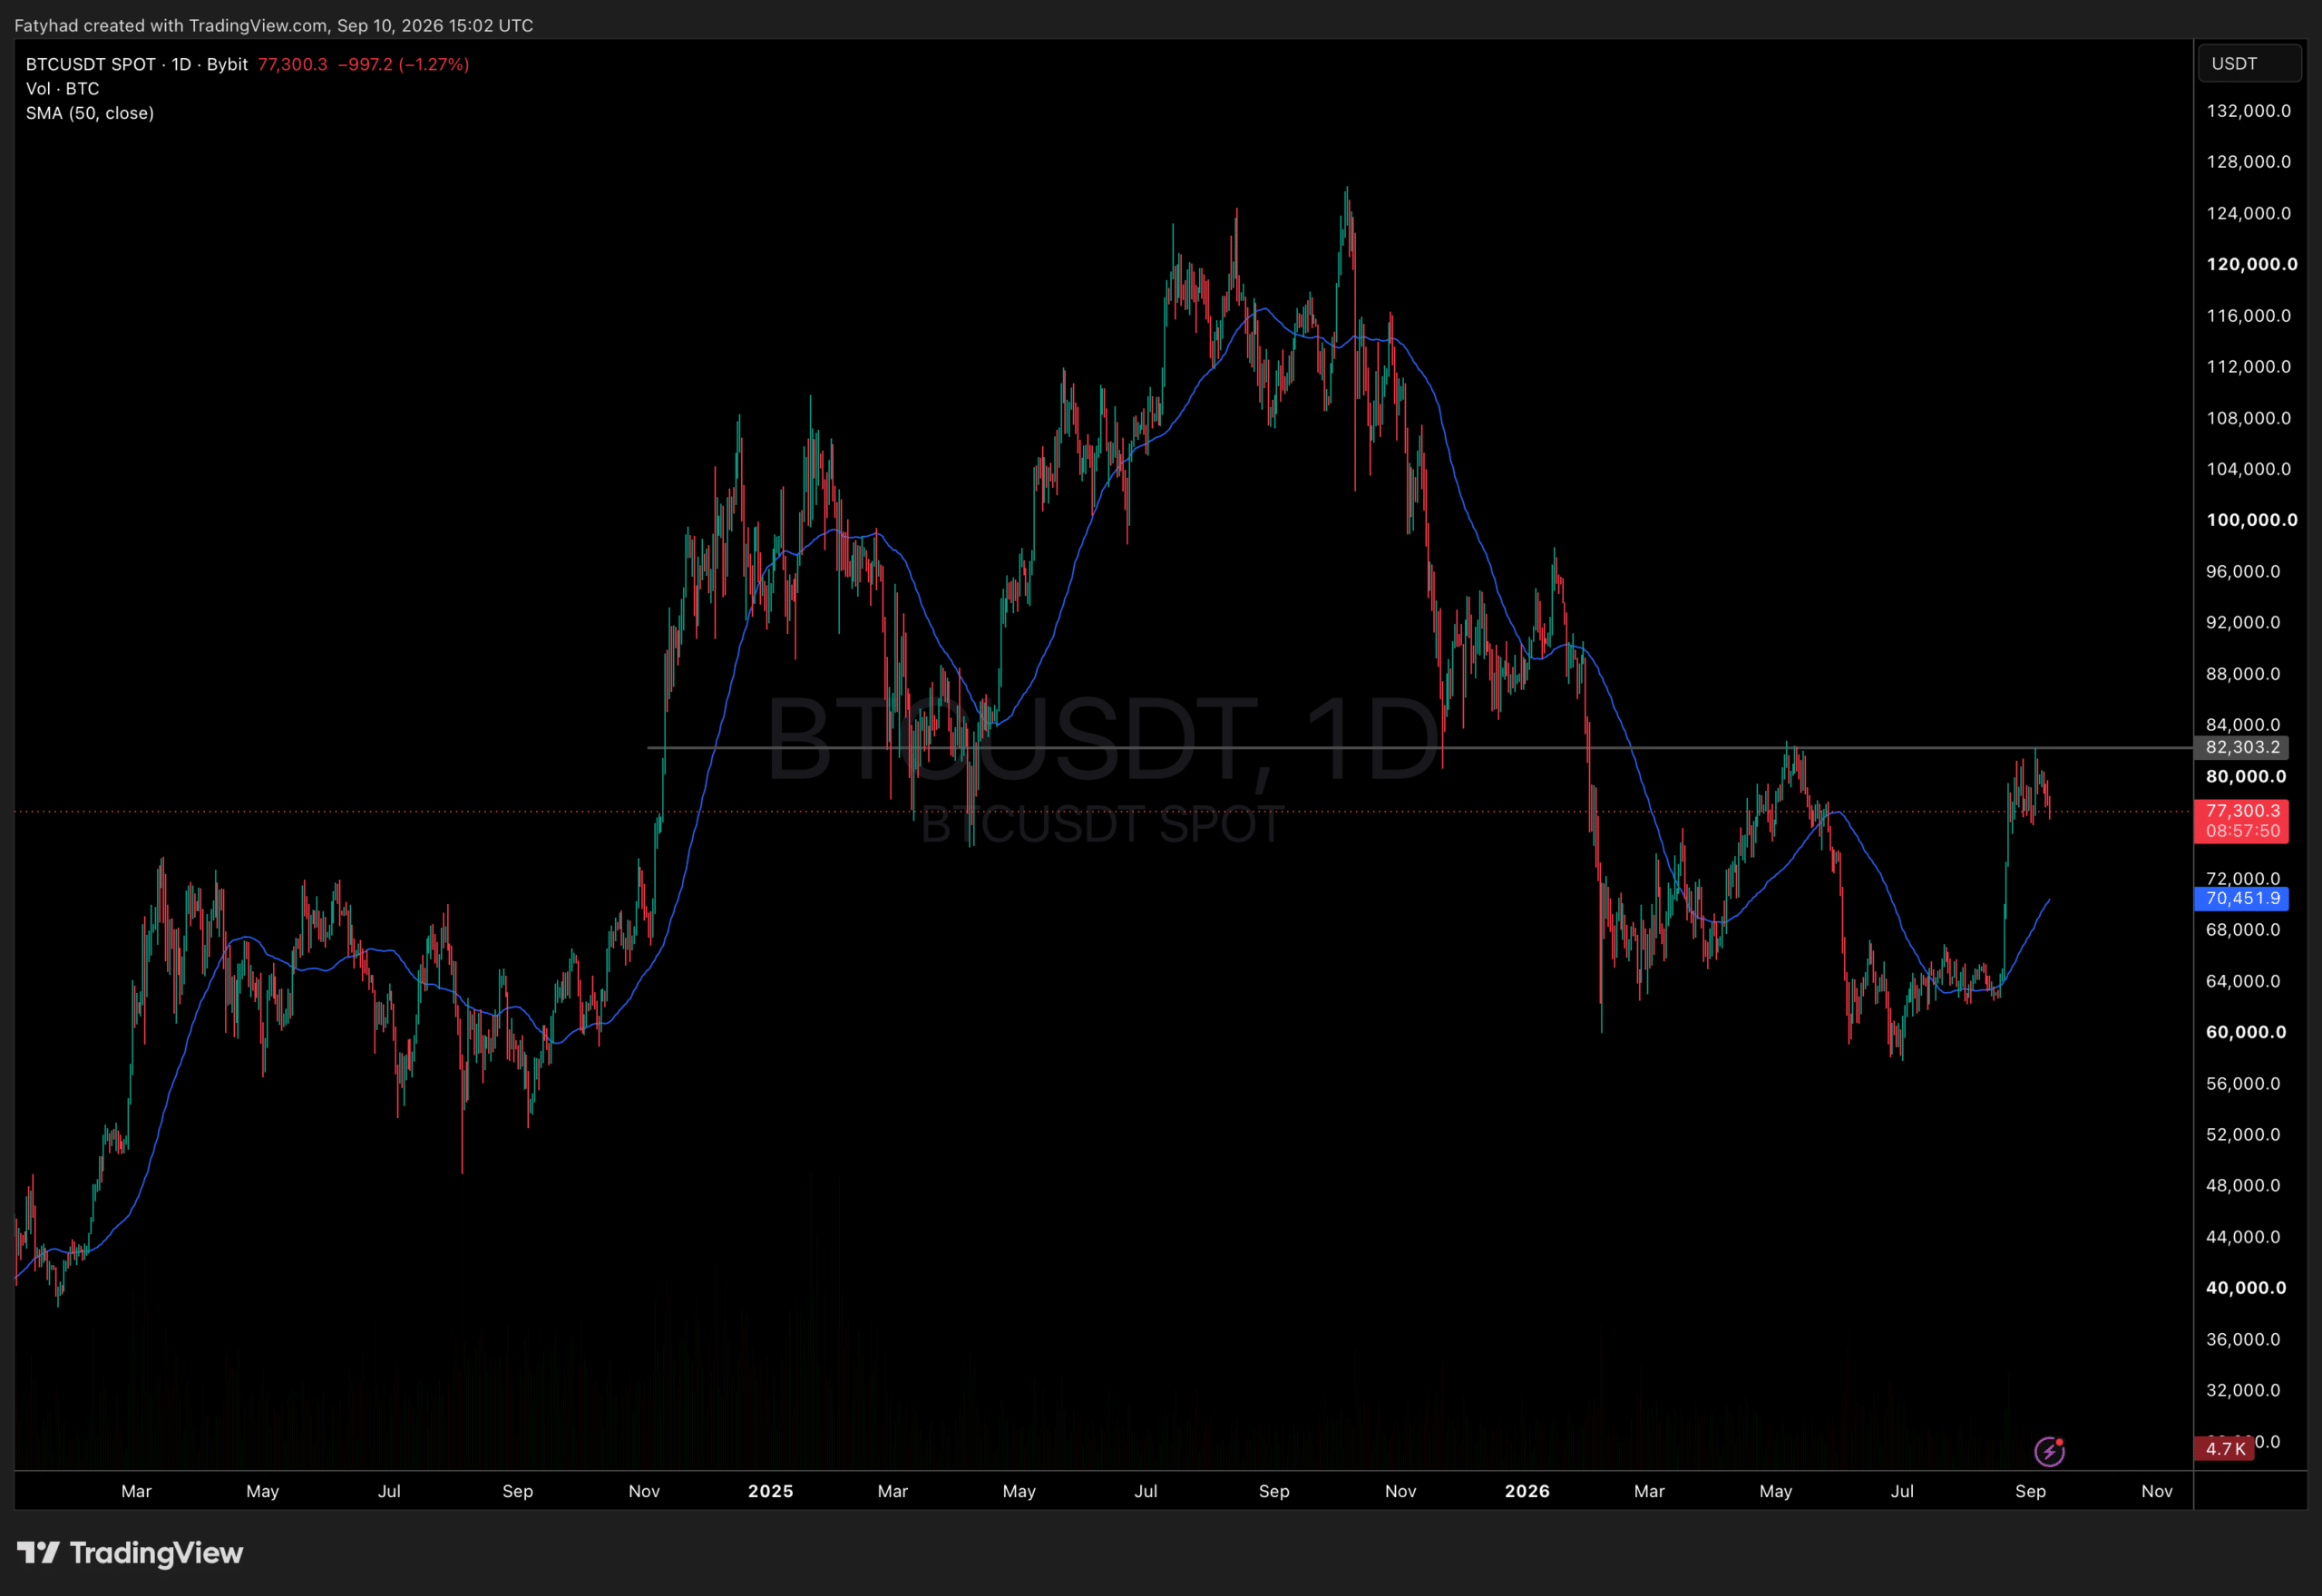
BTC Chart 1D TradingView
BTC is consolidating between $77,000s to low-$78,000s after closing near $78,900 in the prior session. Price remains above both the 50-day and 200-day moving averages (roughly $68,000–$70,000), a structural configuration more associated with bull-phase consolidation than a deepening bear trend.
Immediate support sits at $77,165–$77,200; a break below risks a slide toward $73,000–$74,000. The higher-timeframe floor (the bull-market support band near $69,800–$70,300) remains untested and, for now, largely academic.
Resistance is stacked at $78,800–$79,400, then a thicker band from $80,000 to $82,800, including a Fibonacci “golden retracement” near $82,793.
A decisive close above $80,000 confirms the new leg, with Bitget’s Fibonacci model targeting $82,206 then $97,278. A continued range-bound chop between $76,300 and $79,400 as the market awaits confirmation. A break of $76,000 cost-basis support reopens the $73,000 zone. Renewed spot ETF inflows would tilt this toward the bull case.
Anyone who bought the $76,000 dip is sitting on modest gains, and that’s fine. Bitcoin at this size simply doesn’t produce the multiples it once did. A move from $78,000 to $97,000, per Bitget’s upside target, is roughly 24%, respectable but not life-changing for capital chasing early-stage asymmetry. That’s the gap projects like LiquidChain are built to fill, at a fraction of Bitcoin’s market cap and correspondingly higher variance.
LiquidChain ($LIQUID) is a Layer 3 infrastructure project fusing Bitcoin, Ethereum, and Solana liquidity into a single execution environment: developers deploy once and reach all three ecosystems rather than fragmenting liquidity across chains. The presale is priced at $0.014954 with $964K raised to date.
Core features include a Unified Liquidity Layer, Single-Step Execution, Verifiable Settlement, and Deploy-Once Architecture.
Those tracking Bitcoin’s resilience against macro pressure may find the cross-chain thesis worth a closer look, research LiquidChain before allocating.
Layer 3 Is Already Here, Smart Money Knows It – Do You?
DISCOVER: Best Meme Coins to Buy in 2026
The post Bitcoin Bear Market Ending? Analysts Flagged 2 Bottom Signals appeared first on Coinspeaker.






Nu Global’s launch could revolutionize cross-border finance, enhancing financial inclusivity and efficiency for international users. The post Nu Global launches multi-currency digital account for global
AI firms’ workforce and financing expansion may drive increased valuations and competition, impacting infrastructure investment and market dynamics. The post AI firms expand workforce, secure
US Soccer’s strategic investments and structural reforms aim to elevate its global competitiveness and foster long-term success beyond 2026. The post US Soccer aims to

NEAR Protocol has launched its AI Cloud infrastructure, leveraging Intel and NVIDIA technologies to enhance user data security. This new offering utilizes TEE-hosted inference, ensuring
