

Bitcoin (BTC) dominance currently trades at 58.55% and tests the floor of a range that has held since August 2025. A confirmed breakdown would target 55.5%, the level many traders link to the start of a broad altcoin rotation.
The Crypto Fear and Greed Index sits predominantly in Extreme Fear recently, while the Altcoin Season Index remains neutral at 45. BeInCrypto reviews the weekly and daily BTC.D charts to assess whether the long-awaited altcoin season is finally near.
The weekly chart shows a long-term ascending parallel channel that dates back to late 2022. Bitcoin dominance broke down from this structure in August 2025, ending a multi-year uptrend. The breakdown initiated a sideways period that lasted until April 2026.
In May 2026, the metric rallied back to resistance near 61% and faced a firm rejection. BeInCrypto flagged this area when dominance first broke above 60% in April. BTC.D now trades back inside the former range, below the 0.236 Fibonacci retracement at 59.63%.
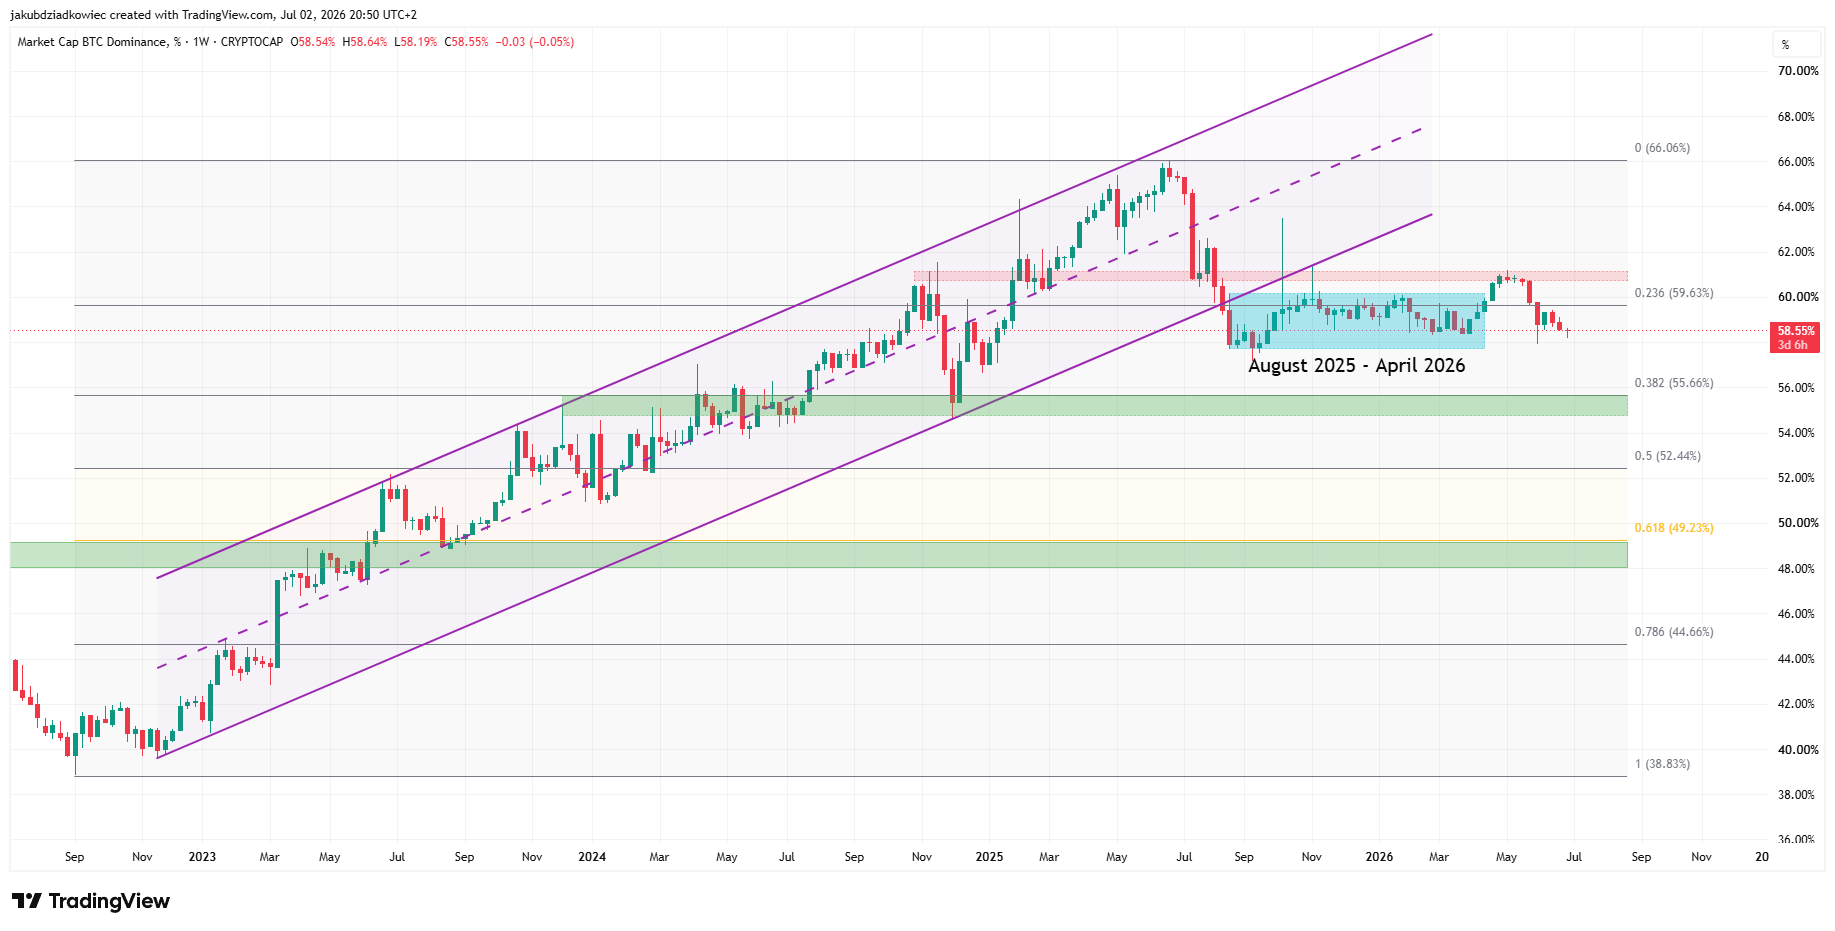
The Fibonacci ladder points to downside targets at 55.66%, 52.44%, and 49.23%. A popular trader on X shared a similar roadmap, calling 55% the trigger level for altcoin moves and 46.74% his final target. His last level sits lower because he anchors the retracement differently.
Zooming in, the daily chart reveals a horizontal parallel channel between roughly 58% and 60.75% that also goes back to August 2025. Dominance now sits on the channel floor and tests a potential bearish breakdown.
Moreover, an ascending trendline from the September 2025 low broke down in June 2026. BTC.D retested the line as resistance in late June and turned lower. The failed retest adds a third bearish signal and pressures the relative position of altcoins, which have trailed Bitcoin since 2020.
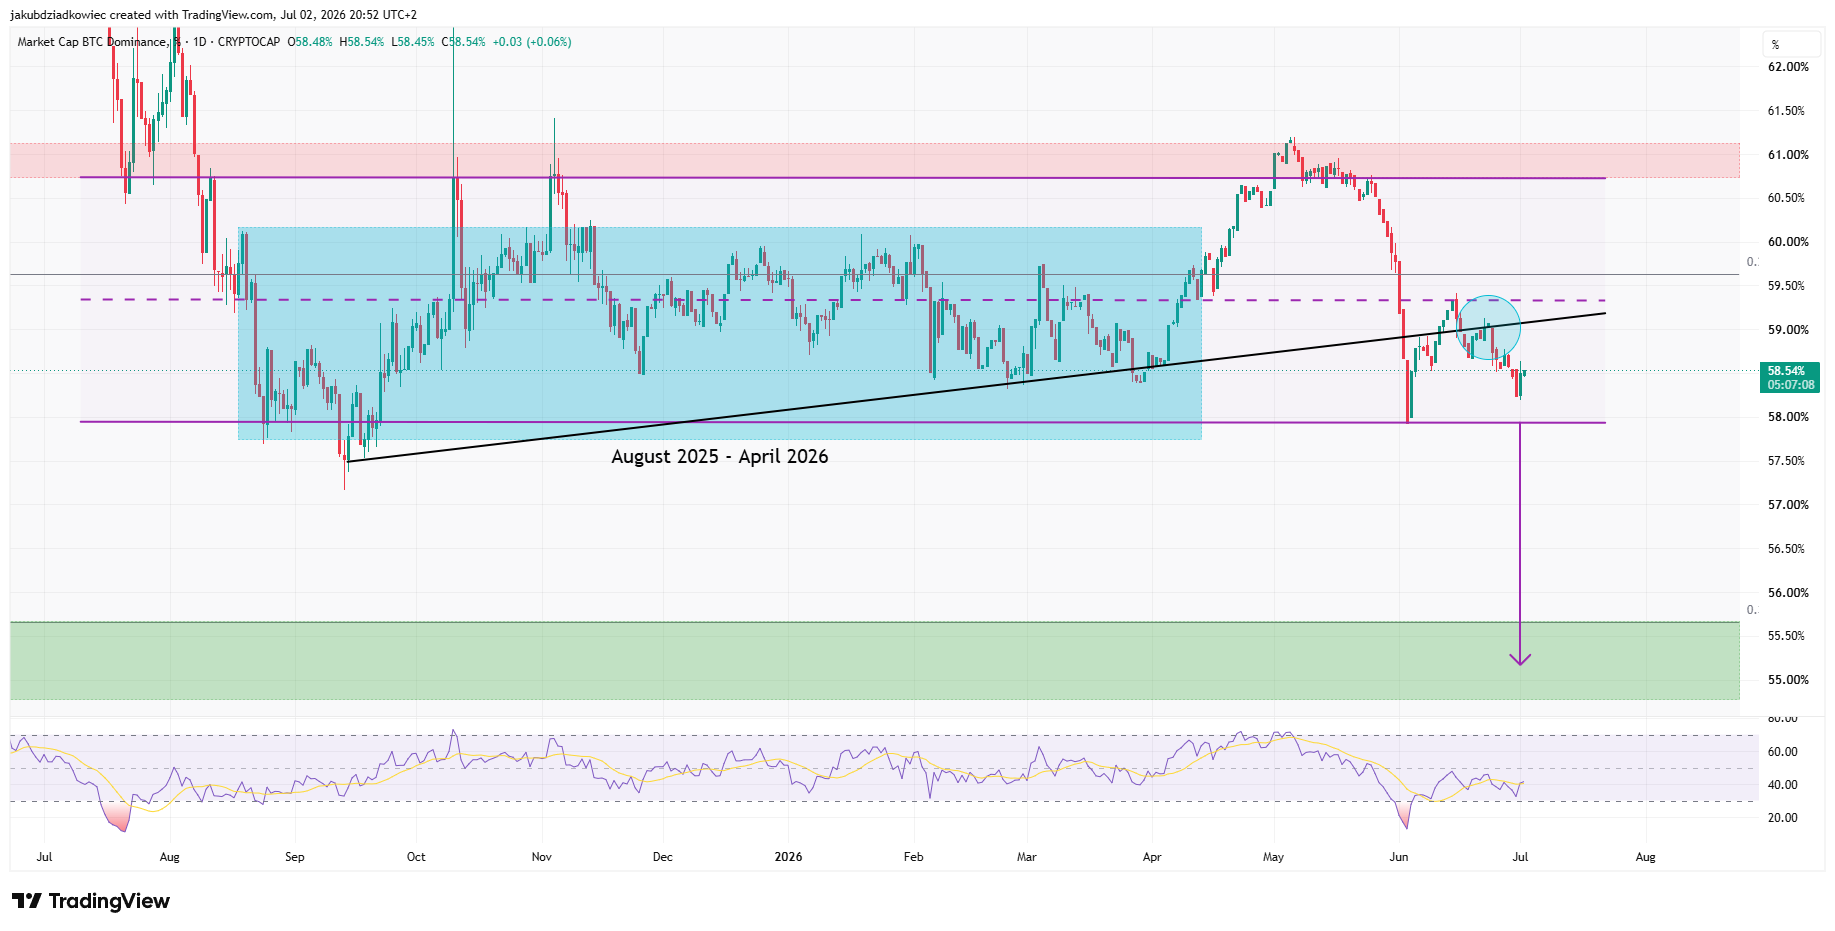
If the channel gives way, the measured target sits near 55.5%. This projection converges with the weekly 0.382 Fibonacci support at 55.66%, creating a strong confluence zone. However, the daily Relative Strength Index (RSI) grinds higher near 40 and remains neutral, so the move still needs confirmation.
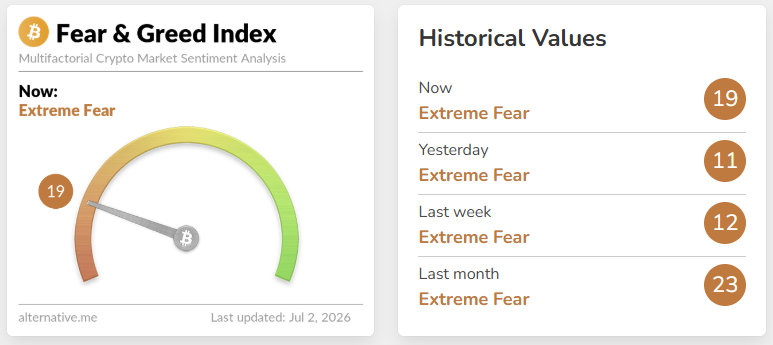
Sentiment adds a contrarian layer to the technical picture. The Crypto Fear and Greed Index printed 19 while Bitcoin still hovered between $60,000 and $61,000, up from 11 July 1, and 12 last week. The gauge has spent a full month in Extreme Fear after June’s correction, driven by a hawkish Fed, geopolitical tensions, and record ETF outflows.
Historically, prolonged readings below 20 have clustered near market bottoms. The index hit a record low of five in February 2026.
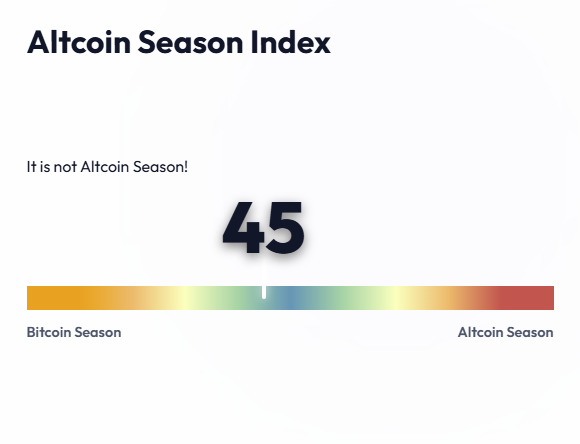
Meanwhile, the Altcoin Season Index from BlockchainCenter stands at 45, almost exactly halfway between Bitcoin season and altcoin season. The index flags altseason only when 75% of the top 50 coins beat Bitcoin over 90 days.
No true altcoin season has arrived since the current dominance structure formed in late 2022. Some experts argue the rotation cannot start until global liquidity expands again.
Bitcoin trades near $61,616, up 2.4% in the last 24 hours, according to CoinGecko. For altcoin holders, the setup remains binary. A weekly close below 55.66% would validate the rotation thesis, while a reclaim of 59.63% would keep capital parked in Bitcoin.
The post Bitcoin Dominance Tests Key Support: Is the Long-Awaited Altcoin Season Finally Near? appeared first on BeInCrypto.


Anthropic’s tightened security measures highlight the growing need for robust legal frameworks to protect AI innovations from unauthorized exploitation. The post Anthropic closes loopholes to
The blasts in Crimea highlight Ukraine’s strategic push to weaken Russian military logistics, potentially shifting regional power dynamics. The post Blasts hit Crimea power substations,
Traders scanning the order books got a surprise when Starknet amplified a post from @CoinMarketCap regarding StarkWare’s ambitious three-phase roadmap aimed at post-quantum security. This
TruYields has officially launched $TRUBILL, a tokenized U.S. Treasury yield product, on the Solana blockchain. This move aims to enhance on-chain yield opportunities and cater