



Bitcoin was hovering near $81,412 in the latest TradingView readings provided for October 28, keeping the $80,000 level in focus ahead of the policy announcement.
Prediction markets placed the probability of the Fed holding its benchmark interest rate steady at 94%, according to the latest market data. However, investors are also watching Chair Kevin Warsh’s press conference for clues about the policy outlook, particularly whether persistent inflation could lead to tighter monetary conditions later this year.
The latest recovery comes as Bitcoin shows signs of improving relative performance against the S&P 500. At the same time, on-chain analytics firm Glassnode has identified a shift toward net short positions among large Bitcoin traders on Hyperliquid, adding another source of uncertainty to the near-term Bitcoin price outlook.
Bitcoin’s return above $80,000 puts the market near a closely watched price zone ahead of the Federal Open Market Committee’s announcement. The latest BTC price readings place the cryptocurrency around $81,412, with trading activity concentrated near several short-term technical indicators and pivot levels.
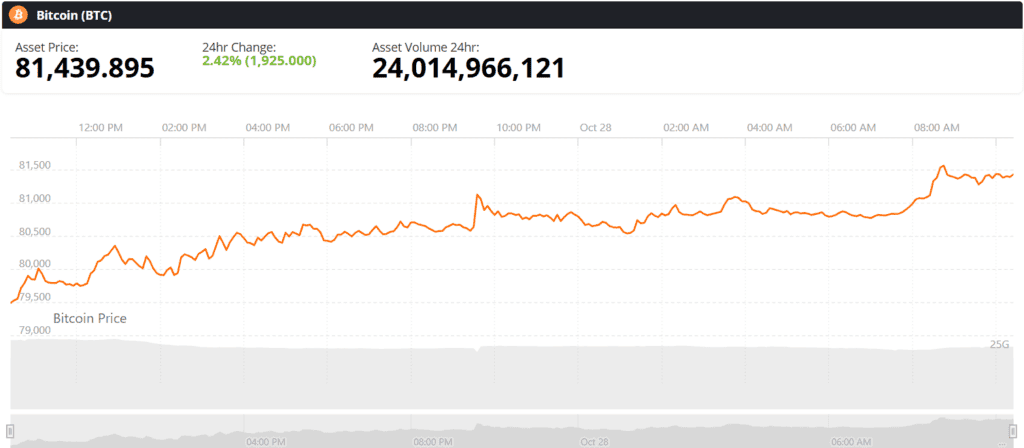
Bitcoin (BTC) price chart. Source: Brave New Coin
The Federal Reserve’s current target range for the federal funds rate is 3.75% to 4.00%, following its September rate increase. Markets broadly expect policymakers to leave rates unchanged at this meeting, although the accompanying statement and Warsh’s comments could influence expectations for the next policy move.
The decision is scheduled for 2 p.m. Eastern Time on October 28, followed by the Fed chair’s press conference. The distinction between the rate decision and the subsequent guidance matters for Bitcoin because an expected hold may already be reflected in prices, leaving traders focused on any unexpected change in the Fed’s assessment of inflation and economic conditions.
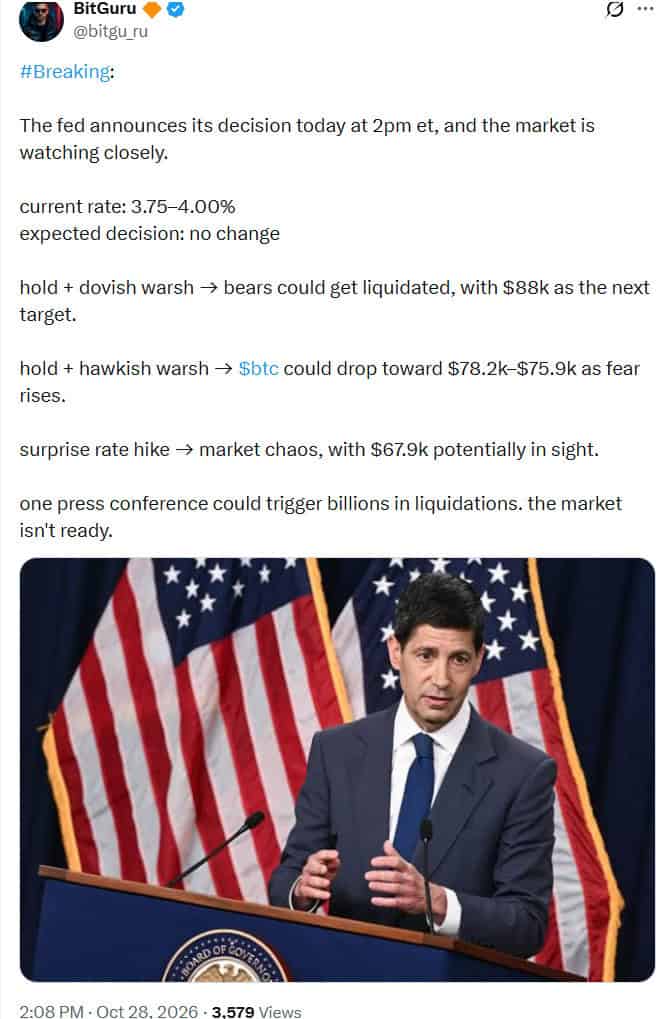
Markets expect the Fed to hold rates at 3.75%–4.00%, while dovish signals could trigger Bitcoin short liquidations toward $88,000. Source: @bitgu_ru via X
Crypto trader @bitgu_ru outlined several possible outcomes tied to the tone of the announcement. In that analysis, dovish comments could support a move toward $88,000, while a more hawkish message could expose BTC to a decline toward $75,900–$78,200. An unexpected rate increase was presented as a more severe downside scenario, with $67,900 identified as a potential target.
These levels represent scenarios from the trader’s analysis rather than confirmed market forecasts. The eventual reaction will depend on how the Fed’s decision compares with expectations, alongside liquidity conditions, positioning, and broader financial-market sentiment.
Glassnode reported that Bitcoin has regained an edge over the S&P 500 in recent trading sessions. Its analysis showed BTC’s daily session win rate moving above 50% on October 20, meaning Bitcoin recorded more winning sessions than losing ones over the period being tracked.
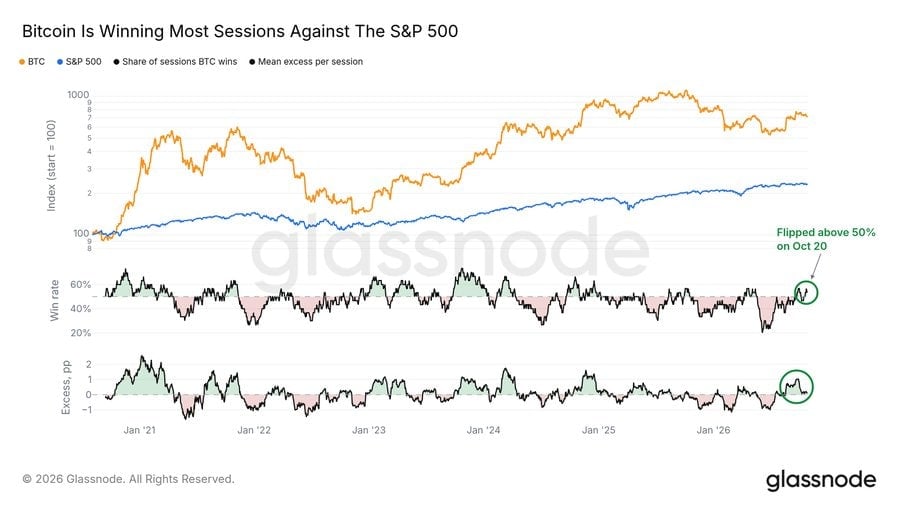
Bitcoin regained its edge over the S&P 500, with its daily win rate surpassing 50% on October 20, 2026. Source: Glassnode via X
The shift follows a difficult stretch in June 2026, when Bitcoin won only one of every five sessions, its weakest result in more than five years, according to the supplied Glassnode findings. The recent improvement suggests that Bitcoin’s relative performance has strengthened after a prolonged period of underperformance.
A session win rate measures how frequently an asset records a positive session under a defined methodology. It does not necessarily mean Bitcoin has delivered a higher total return than the S&P 500 over every period, nor does it establish that the trend will continue. The broader indexed-price comparison and excess returns per session provide additional context for assessing the change.
Glassnode’s analysis also points to the possibility that sustained outperformance could attract further capital. Investors sometimes increase exposure to assets that have recently performed better, potentially reinforcing an existing trend. However, this type of flow can reverse quickly if market conditions deteriorate or the asset loses its relative advantage.
For the current Bitcoin price outlook, the comparison with equities offers a useful measure of market strength. Bitcoin’s improving session record provides a constructive signal, but the upcoming Fed announcement could test whether that relative performance can persist through a fresh macroeconomic catalyst.
Despite Bitcoin’s recovery, positioning among large traders has become more cautious. Glassnode reported that tracked whales on Hyperliquid shifted to net short Bitcoin perpetual futures last week for the first time since March 2026.
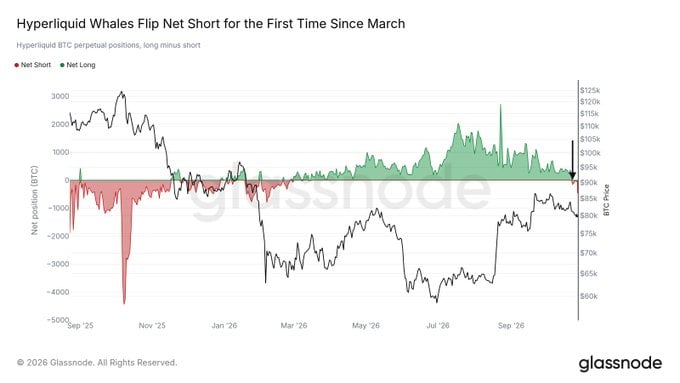
Hyperliquid whales turned net short on Bitcoin perpetuals for the first time since March 2026, after correctly anticipating the recent price bottom. Source: Glassnode via X
Net short positioning means that short exposure exceeds long exposure within the group being measured. Traders may establish such positions to profit from a decline, hedge existing holdings, or manage exposure to volatility. The data therefore indicates a change in positioning, not a guarantee that the market will fall.
The shift is notable because these traders had previously moved into long positions near Bitcoin’s recent price bottom. Their reversal as BTC returned to the $80,000 area suggests that some large participants are preparing for additional downside or are reducing their confidence in an immediate recovery.
Glassnode’s findings leave two broad possibilities. If Bitcoin breaks below important support levels, the increase in bearish positioning could accompany a deeper correction. If BTC instead rebounds toward $85,000, traders holding short positions could face pressure to close them, potentially adding buying demand to the move.
A short squeeze occurs when rising prices force short sellers to buy back positions to limit losses or meet margin requirements. Such buying can accelerate an advance, particularly when leverage is elevated. However, the scale of any squeeze would depend on the size and concentration of positions, available liquidity, and the speed of the price move.
For now, the change in whale positioning creates a counterweight to Bitcoin’s improving performance against equities. The Fed’s decision may provide a catalyst, but price action around support and resistance will be important in determining whether traders’ defensive positioning proves timely.
TradingView’s technical summary for BTCUSD on Bitstamp showed a broadly neutral picture in the latest readings supplied for October 28. Across the combined set of oscillators and moving averages, the summary recorded nine sell signals, nine neutral readings, and eight buy signals.
Oscillators were also predominantly neutral, with two sell readings, eight neutral readings, and one buy reading. The Relative Strength Index (RSI) stood at 48, indicating neither an overbought nor an oversold condition. The Average Directional Index (ADX) was at 17, suggesting that the prevailing trend lacked strong directional momentum under the indicator’s usual interpretation.
Other momentum measures leaned slightly bearish. The Momentum (10) indicator registered a sell signal, while the MACD level was also negative and rated sell. These readings were offset by a buy signal from Bull Bear Power and a more balanced set of moving-average signals.
The moving averages show why the immediate bitcoin price prediction remains uncertain. BTC was trading above several longer-term averages, including the 100-period and 200-period exponential moving averages at approximately $77,766 and $76,396, respectively. The 100-period and 200-period simple moving averages were also below the current price, at roughly $75,924 and $73,067.
By contrast, several intermediate averages remained above the latest price. The 20-period exponential moving average stood near $81,717, while the 20-period simple moving average was around $81,842. The 30-period simple moving average was higher still, near $82,697. This split indicates that longer-term trend measures remain comparatively supportive while shorter-term indicators reflect the recent pullback.
The TradingView pivot calculations identify the $81,950 area as the central classic pivot, with the Ichimoku base line near $83,057. Together, these levels create an initial resistance zone that Bitcoin would need to clear to strengthen its short-term recovery.
Above that area, the Camarilla resistance levels stand near $84,705, $85,847, and $86,989. These levels overlap with the broader $85,000–$87,500 supply zone highlighted in Glassnode’s October market analysis, where selling interest and liquidation clusters have been concentrated. A sustained move through this region would provide stronger evidence that buyers are absorbing overhead supply.
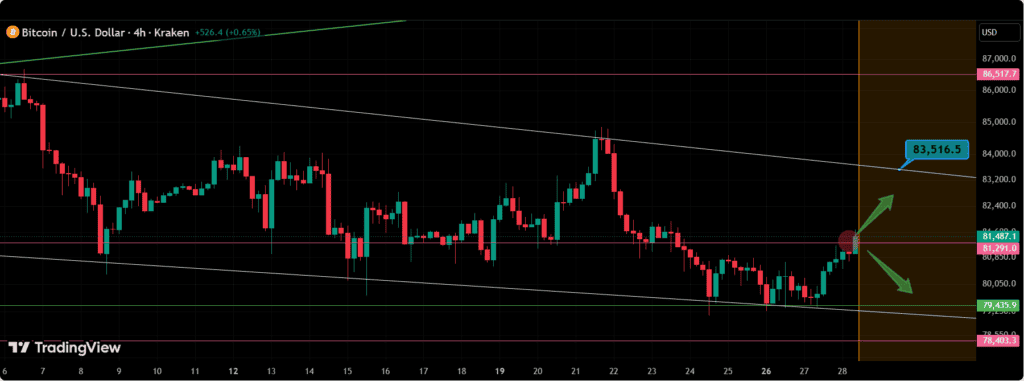
BTC bounced off the bottom of the descending channel and is back at the level that capped it. Source: CryptoCT01 on TradingView
The $80,000 level remains an important reference point. The Camarilla support levels are near $81,278 and $80,136, while the classic S1 pivot sits at $76,526. Fibonacci pivot support is near $77,190, with additional levels lower down. These are technical reference points rather than guaranteed turning points.
These levels are based on the supplied TradingView snapshot and market analysis. Indicator values can change as new candles form, while pivot levels depend on the underlying calculation period. Traders should confirm the readings against live charts before using them to assess risk.
The October 28 FOMC decision places monetary policy at the center of the near-term Bitcoin outlook. A rate hold that matches expectations may have a limited immediate effect if markets have already priced it in. The more consequential signal could come from Warsh’s comments about inflation, the economic outlook, and the possibility of another rate increase.
A dovish tone could improve risk appetite by reducing concerns about tighter financial conditions. Such a reaction may support Bitcoin and other risk-sensitive assets, although the response would also depend on Treasury yields, the US dollar, and broader equity-market performance.
A hawkish message could have the opposite effect. If policymakers emphasize persistent inflation or signal that further tightening remains possible, traders may reassess the outlook for liquidity and risk assets. Bitcoin could then face renewed selling pressure, especially if bearish derivatives positioning coincides with a break below support.
The wider market backdrop remains important. Bitcoin’s improved session win rate against the S&P 500 offers evidence of a relative recovery, but the shift in Hyperliquid whale positioning shows that large derivatives traders are not uniformly confident in further gains. The two signals measure different aspects of the market and can coexist.
For investors tracking Bitcoin price news today, the key indicators are therefore the Fed’s policy language, BTC’s ability to defend $80,000, and its reaction around the $82,000–$83,000 resistance area. A sustained breakout could strengthen the recovery case, while a decisive support failure would increase the risk of a deeper pullback.
Bitcoin has recovered above $80,000, but the technical indicators remain mixed and large-trader positioning has turned more defensive. The Fed’s decision and subsequent press conference may help determine which signal gains the upper hand. Until price breaks clearly beyond the current trading range, a neutral outlook remains consistent with the available evidence.






XRP’s prolonged price lull may be testing investors’ patience, but one veteran trader believes the cryptocurrency is quietly setting the stage for something much bigger.
ZeusRWA put the tokenized stock market at $4.63 billion, with U.S. assets held in custody accounting for 85.7% of the total.
The Nov. 30 payment is for shareholders listed on Nov. 12, which is also the ex-dividend date.
The payment is scheduled for Dec. 17. Dec. 10 is both the record date and ex-dividend date.
