



The rally pushed BNB more than 10% higher in a short period, drawing attention from traders who have been monitoring the asset’s prolonged consolidation range. While analysts remain cautious about predicting future price movements, the breakout has shifted focus toward higher resistance zones, with $760 emerging as the next major level on the charts.
The latest move came shortly after Binance teased an undisclosed product reveal scheduled for June 1, 2026. The announcement sparked speculation across the crypto market and coincided with a sharp increase in buying activity for BNB.
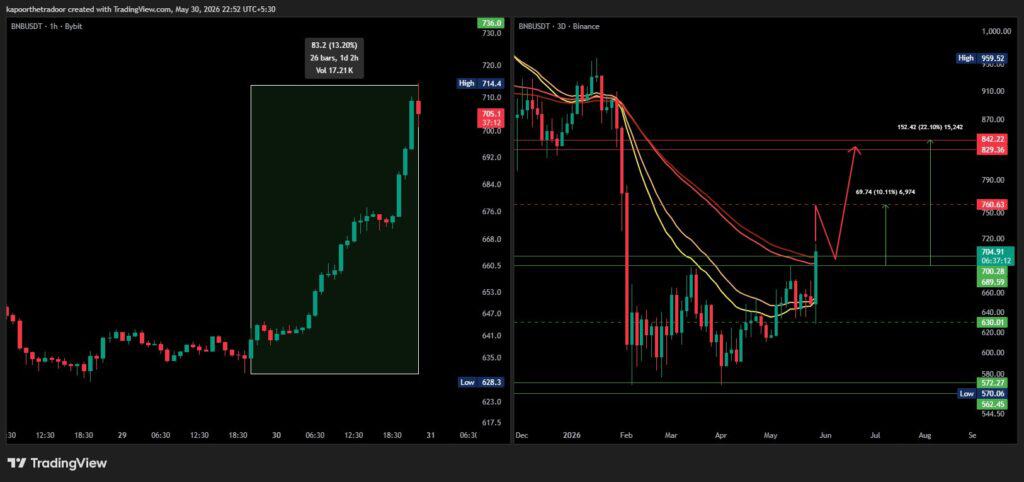
BNB surged 10% after Binance’s June 1 teaser, breaking above the key $700 resistance level and opening a potential path toward $760 if the breakout is sustained. Source: Kapoor Kshitiz via X
Former Binance CEO Changpeng Zhao (CZ) added to the excitement with a lighthearted social media post describing the event as an “announcement of an announcement,” a remark that quickly circulated among traders and investors.
Technical analyst Kshitiz Kapoor highlighted the significance of the move, noting that BNB successfully pushed above a resistance zone that had repeatedly capped upside attempts over recent months. According to his analysis, maintaining support above the breakout area could open the door for a move toward $760, while a stronger continuation rally could eventually expose the $842 region.
Although market sentiment has improved, analysts generally caution that price action still needs confirmation through sustained closes above key resistance levels rather than relying solely on speculation around upcoming announcements.
From a broader perspective, BNB’s market structure has become increasingly constructive in recent weeks.
The asset continues to trade within a large broadening formation that has defined much of its 2026 price action. The upper boundary of this range remains near $960, while the lower support zone sits around $570.
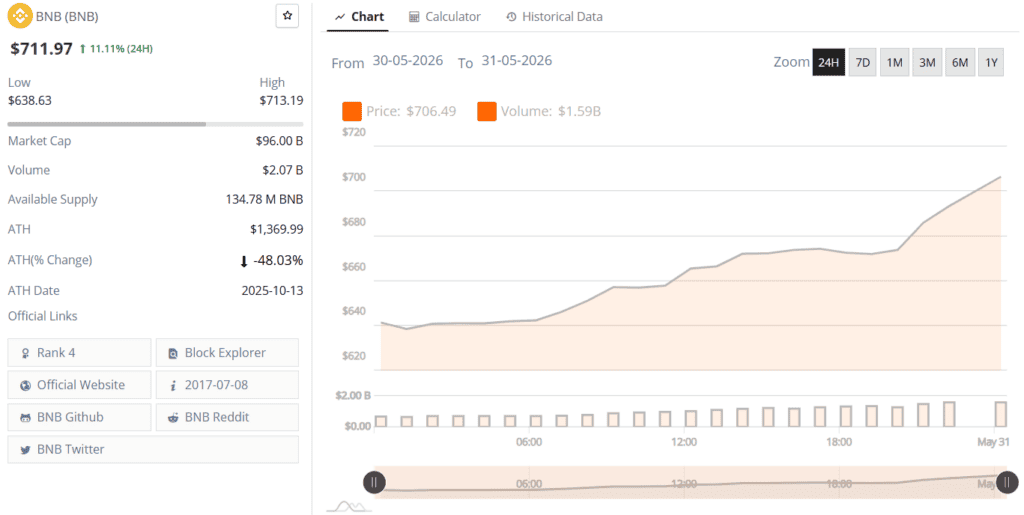
$BNB was trading at around $712, up 11.11% in the last 24 hours at press time. Source: Brave New Coin
A notable development has been the formation of a higher low near $640 during May. This level was successfully held during a retest, preventing a deeper correction and signaling that buyers are stepping in earlier during pullbacks.
Market technicians often view higher lows as an indication of strengthening demand, particularly when they occur beneath major resistance levels. In BNB’s case, the pattern suggests that buyers have gradually become more aggressive while sellers continue defending the $700 region.
The recent impulse move from $640 back toward the upper end of the range has therefore attracted attention as a potential shift in market dynamics.
The $700 area has acted as one of the most significant technical barriers for BNB throughout the past three months.
Each previous rejection weakened selling pressure at the level as supply was gradually absorbed by buyers. The latest breakout represents the fourth major challenge of this resistance zone, increasing its technical importance.
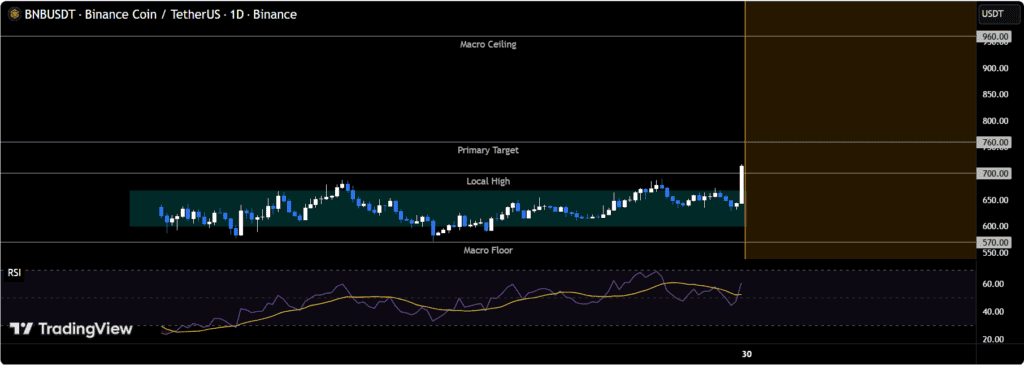
BNB is testing the $700 resistance for the fourth time in three months, with a confirmed daily close above the level potentially paving the way for a move toward the $760 target. Source: 3Commas on TradingView
According to chart analysis shared by 3Commas, a sustained daily close above $700 could trigger additional buying activity from traders who had been waiting for confirmation. It may also force short sellers positioned around resistance to cover their positions, adding further upward pressure.
If the breakout remains intact, analysts identify $760 as the next major liquidity zone. The area corresponds with a previous breakdown level from February and could attract increased market participation as traders reassess positioning.
On the downside, a loss of support around $640 would weaken the current bullish outlook and potentially shift attention back toward the broader $600-$570 support region.
Beyond price action, several widely followed indicators suggest that BNB’s longer-term trend remains favorable despite some lingering short-term uncertainty.
The Relative Strength Index (RSI) currently stands near 52.8, placing it in neutral territory. This reading indicates that the asset is neither overbought nor oversold, leaving room for further movement in either direction.
Meanwhile, the MACD (12,26) continues to generate a buy signal with a reading around 1.5, suggesting that positive momentum remains intact even though acceleration has been modest.
Trend strength has also improved. The Average Directional Index (ADX) is hovering near 25.2, a level that typically signals the emergence of a more meaningful trend after periods of consolidation.
Some shorter-term indicators remain mixed. The Stochastic RSI is near 11.4, reflecting oversold conditions that often precede relief rallies, while the Williams %R indicator sits around -60.9, indicating that buyers have not yet established complete control of momentum.
The Bull/Bear Power reading remains slightly negative at -0.21, showing a modest advantage for sellers in the short term, although bearish pressure appears limited.
Perhaps the most encouraging signal for BNB bulls comes from the asset’s position relative to key moving averages.
BNB remains above its major medium- and long-term trend indicators, including the:
Holding above these levels generally reflects a healthy underlying market structure and suggests that the broader uptrend remains intact.
Shorter-term moving averages continue to issue sell signals, indicating that some consolidation may still occur following the recent rally. However, the divergence between short-term weakness and long-term strength often appears during transitional periods when markets are attempting to establish a new trend direction.
For now, Binance Coin’s successful move above $700 has shifted market attention toward the $760 target. Whether the breakout develops into a larger rally will likely depend on the asset’s ability to maintain support above former resistance while broader market sentiment remains favorable.









The Bitcoin network received a fresh difficulty bump this week at block height 951552, with the protocol dialing things up by 1.72%. Meanwhile, the network’s
Ethereum price is still fighting to hold one of its most important short-term zones as the market remains split between bearish pressure and early recovery
Stable job growth and unemployment may delay Fed rate cuts, but declining labor participation could signal underlying economic challenges. The post US jobs report set
BraveNewCoin data placed LINK at $9.19, up 1.34% over 24 hours, while the token traded between $8.93 and $9.29 during the session. Notably, the short-term
