

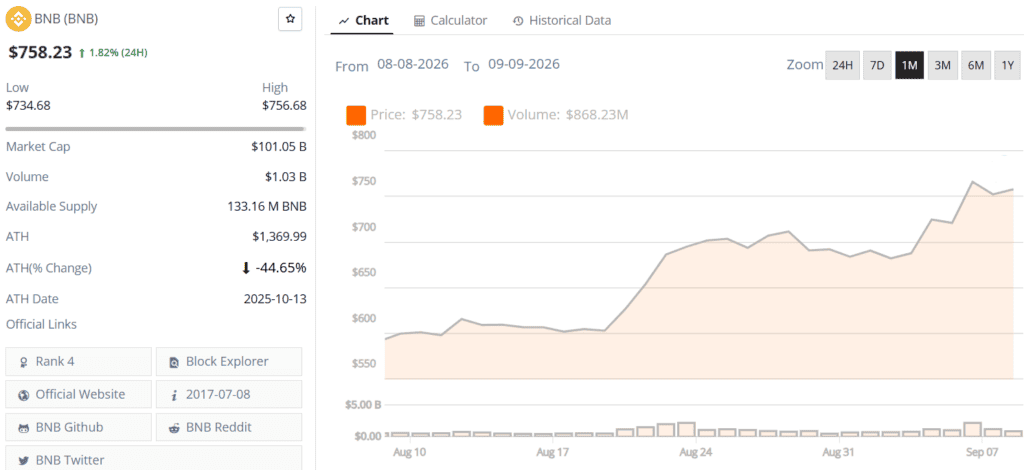
The BNB price climbed from around $538 in recent months and briefly reached $780.49 on September 5 before pulling back toward the mid-$700s.
At the time of writing, BNB is trading around the $740-$755 area, leaving traders focused on whether the recent advance can develop into a sustained breakout. Several technical analysts are highlighting $730-$745 as an important support region, while $770 remains a major resistance level.
Analyst @Garreett_G describes the BNB chart as “technically constructive,” with the $730 area emerging as an important level for the next phase of the move.
The chart places the 0.5 Fibonacci retracement near $728 and the 0.618 retracement around $715. Both levels sit close to an ascending trendline, creating a technical support cluster beneath the current price.
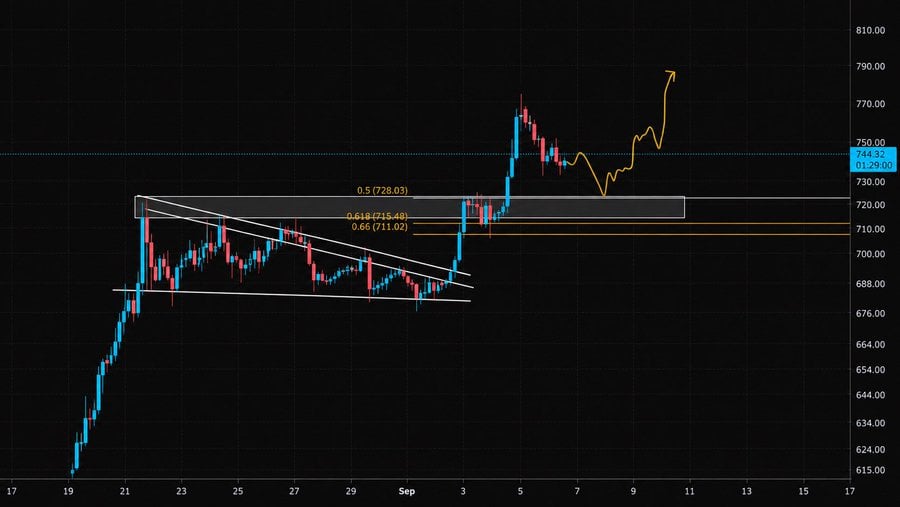
BNB remains constructive, with $730 identified as the key support level for a potential move higher. Source: @Garreett_G via X
A successful retest of this zone would allow the price to preserve the higher-low structure established during its recent recovery. Conversely, a sustained move below the trendline and $715 area would weaken the setup and shift attention toward lower support levels.
Recent market data shows why the zone matters. BNB fell from $766.50 on September 6 to $739.90 on September 7 before recovering modestly on September 8.
Another analyst, DrDovetail, points to a separate technical development: BNB has moved above a descending channel while also registering a golden cross.
The analyst wrote that the Binance coin is “above the channel & just golden crossed,” adding that “$900 seems likely” if the broader altcoin market enters a sustained rally.
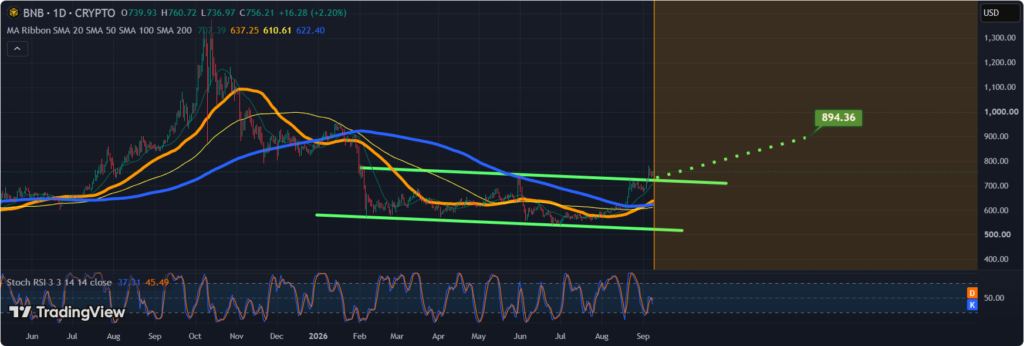
BNB could target $900 if the broader altcoin market enters a sustained alt season, with the level also potentially serving as the right-shoulder zone of an inverse head-and-shoulders pattern. Source: DrDovetail on TradingView
A golden cross occurs when a shorter-term moving average moves above a longer-term moving average. Traders generally view the formation as evidence that momentum has shifted in a more constructive direction, although it does not guarantee further gains.
DrDovetail also highlighted the possibility of BNB using the $900 area as the right shoulder of a potential inverse head-and-shoulders pattern. Such a structure would require additional confirmation before becoming a valid breakout setup.
The distinction is important because the price remains well below its previous record high. Historical market data places the token’s all-time high at $1,375.11, recorded in October 2025.
While the longer-term setup has improved, BNB still faces a significant hurdle around $770.
Ucan_Coin identified $770 as critical resistance after the price recovered through $600.53 and $673.28. At the time of the analysis, BNB was trading near $748.
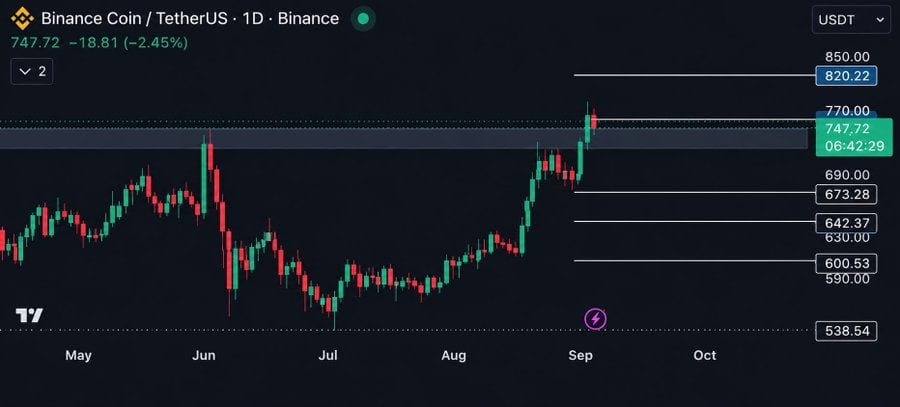
A daily close above $770 could strengthen BNB’s bullish momentum, targeting $820.22, with a breakout above that resistance further confirming the bullish structure. Source: @Ucan_Coin via X
According to the setup, a daily close above $770 would open the way toward approximately $820.22. That would make $770 the first major confirmation level for an extension of the current rally.
The recent price action reinforces that view. The Binance coin reached $780.49 on September 5 but subsequently retreated, showing that sellers remain active above the $770 area.
A failure to reclaim the level could instead leave the price ranging below resistance. Ucan_Coin’s downside levels include $673.28, $642.37, and $600.53.
A separate weekly-chart analysis places emphasis on $745 rather than $770.
The analyst argued that a weekly close above $745 would establish the first “proper higher high” while simultaneously reclaiming the 50-week and 100-week exponential moving averages. The analysis identifies $933 as the next major upside level.
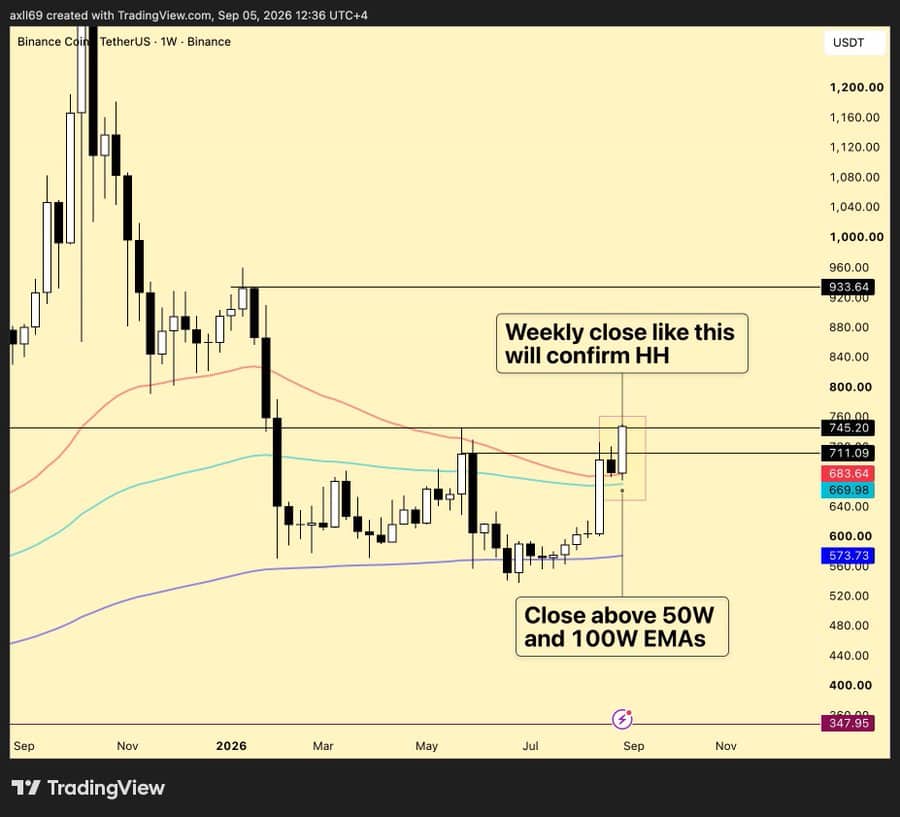
BNB’s weekly structure remains bullish, with a close above $745 potentially confirming a higher high and reclaim of the 50-week and 100-week EMAs, putting $933 in focus. Source: @Axel_bitblaze69 via X
BNB’s recent price action has already moved through that area, although confirmation depends on the timeframe being measured. The token traded as high as $780.49 on September 5 before closing at $766.50, followed by a close near $739.90 on September 7.
That makes the distinction between an intraday breakout and a sustained weekly move particularly important. A durable close above resistance would provide stronger evidence that the recovery is developing into a broader trend reversal.
The technical picture is developing alongside upgrades to the underlying BNB Chain network.
BNB Chain activated the Pasteur hardfork on August 25. According to the project’s official documentation, the upgrade introduced changes aimed at strengthening bridge, staking and governance security while increasing block capacity. Testnet benchmarks for the BEP-675 component showed throughput rising from 1,237 to 2,324 transactions per second under a controlled workload.
BNB Chain also says the upgrade is part of its broader H2 2026 roadmap, which targets higher mainnet throughput. The project’s release notes confirm that the Pasteur hardfork was scheduled for August 25 and required BSC mainnet nodes to upgrade beforehand.
These developments do not directly determine BNB’s price, but they provide additional context around the network supporting the token as traders assess its longer-term utility.
The path toward $900 currently involves several technical checkpoints rather than a single breakout.
First, BNB needs to maintain the $730-$745 region during pullbacks. Holding this area would preserve the recent higher-low structure and keep the ascending trendline intact.
BNB price chart. Source: Brave New Coin
Next, bulls would need to overcome the $770 resistance zone. A confirmed daily breakout could bring the $820 area into focus, in line with Ucan_Coin’s technical projection.
Beyond that, $900 becomes a larger psychological and technical objective. PrimeXBT similarly identified $800 as an intermediate resistance after the price moved through the $740-$760 region, with $900 becoming relevant if the breakout holds.
From the current area near $750, a move to $900 would represent roughly 20% upside. However, the level remains a technical projection rather than a confirmed price target.
BNB’s latest structure has several constructive elements: a recovery from the $538 area, an upward-sloping trendline, a reported golden cross, and a move above the descending channel highlighted by traders.
Still, the market has yet to establish a sustained break above $770. The recent rejection from $780.49 demonstrates that resistance remains active.
For the bullish scenario to strengthen, BNB would need to hold the $730-$745 support region and produce a convincing move through $770. A subsequent break above $820 would provide another confirmation point before the $900 region becomes a more credible medium-term objective.
If BNB instead loses the $715-$730 support cluster, the bullish structure would face greater pressure, with the lower levels around $673 and $642 becoming relevant again.
For now, the technical evidence supports watching the breakout levels rather than assuming the $900 objective is already established.






With shifting macroeconomic signals reshaping the Bitcoin FOMC outlook, BTC has breached the $81,000 mark. We break down the market’s latest rally and explore how
Ethereum holds near $2,490 as Harmony sunsets its Layer-1 and migrates ONE to ETH. Key resistance, support levels, and where capital is rotating. The post
The August jobs report sent Bitcoin below $81,000 as traders raised rate-hike bets, while $730.8 million in Bitcoin ETF inflows continued. The post Trump Crypto

The liquidation highlights increased market volatility, prompting investors to reassess risk management and leverage strategies in crypto trading. The post $188M in long positions liquidated

