Dogecoin started a recovery wave above the $0.1040 zone against the US Dollar. DOGE is now facing hurdles near $0.1075 and might struggle to continue higher.
Dogecoin price started a recovery wave from the $0.1020 zone, like Bitcoin and Ethereum. DOGE climbed above the $0.1035 and $0.1040 resistance levels.
There was a decent upward move above the 23.6% Fib retracement level of the downward move from the $0.1127 swing high to the $0.1021 low. Besides, there was a break above a bearish trend line with resistance at $0.1040 on the hourly chart of the DOGE/USD pair.
Dogecoin price is now trading below the $0.1075 level and the 100-hourly simple moving average. If there is another recovery wave, immediate resistance on the upside is near the $0.1062 level. The first major resistance for the bulls could be near the $0.1075 level or the 50% Fib retracement level of the downward move from the $0.1127 swing high to the $0.1021 low.
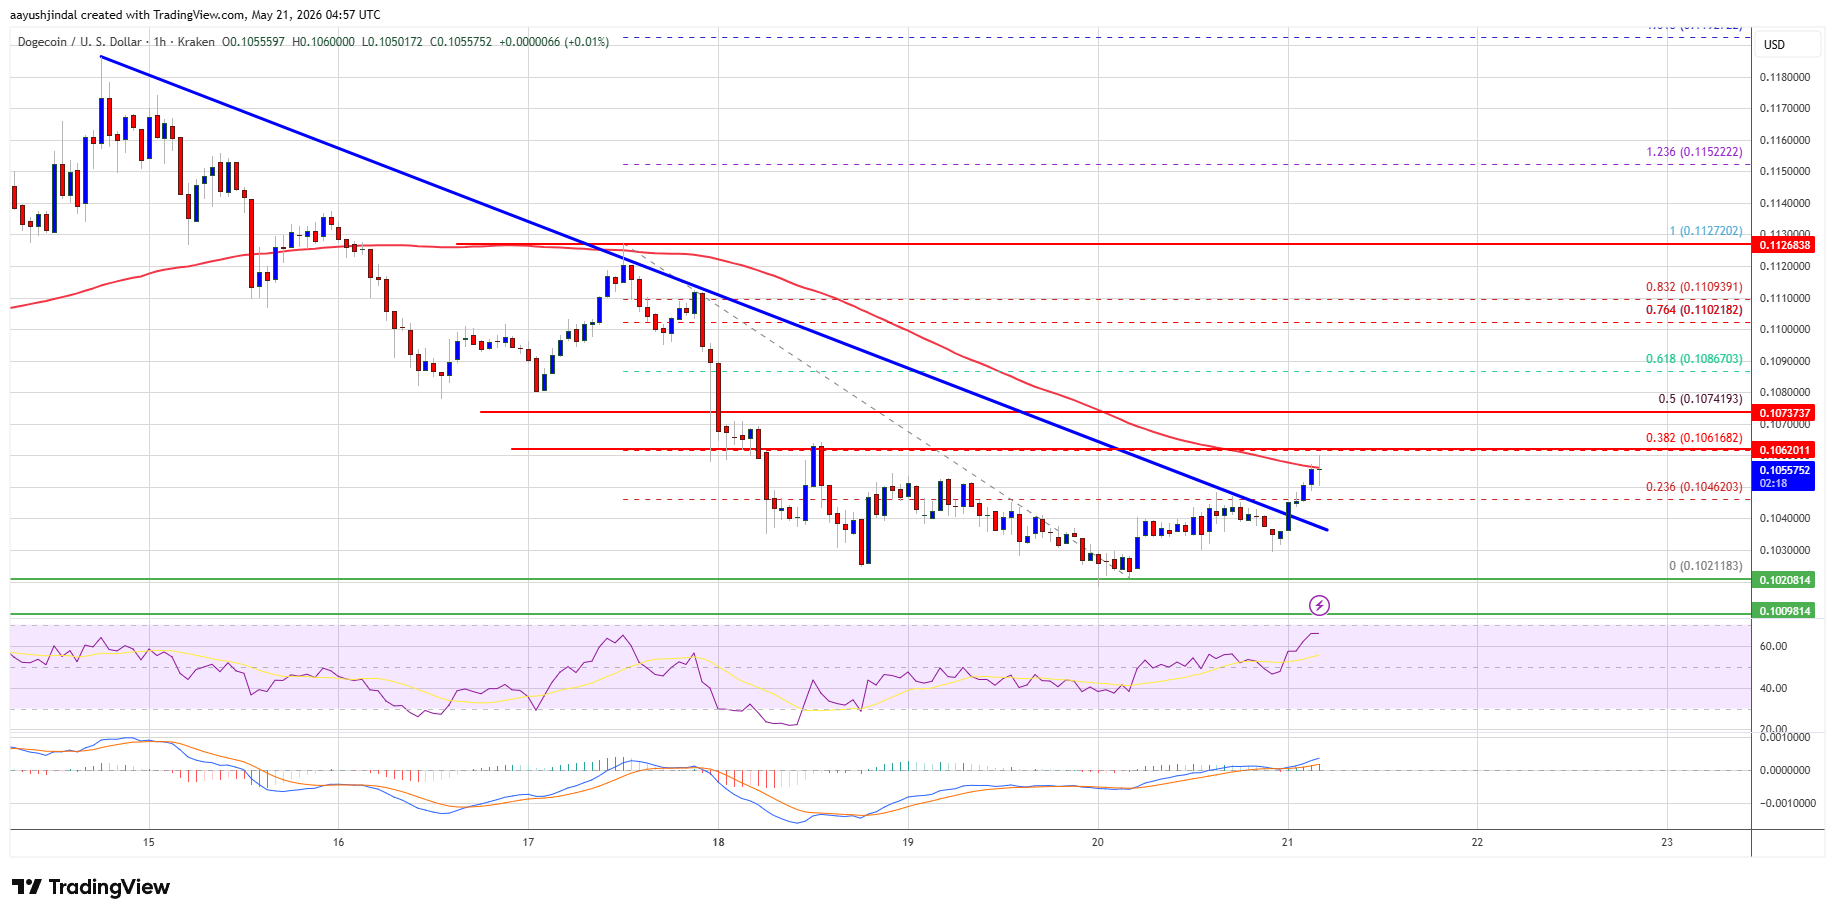
The next major resistance is near the $0.1088 level. A close above the $0.1088 resistance might send the price toward the $0.1120 resistance. Any more gains might send the price toward the $0.1150 level. The next major stop for the bulls might be $0.1165.
If DOGE’s price fails to climb above the $0.1075 level, it could continue to move down. Initial support on the downside is near the $0.1040 level. The next major support is near the $0.1020 level.
The main support sits at $0.10. If there is a downside break below the $0.10 support, the price could decline further. In the stated case, the price might slide toward the $0.09650 level or even $0.0950 in the near term.
Technical Indicators
Hourly MACD – The MACD for DOGE/USD is now gaining momentum in the bullish zone.
Hourly RSI (Relative Strength Index) – The RSI for DOGE/USD is now above the 50 level.
Major Support Levels – $0.1040 and $0.1020.
Major Resistance Levels – $0.1075 and $0.1120.


Crypto News Today: Bitcoin ETF outflows grow as Trump IRS controversy, ETF filing withdrawal, and Iran tensions shake the market hard. The post Crypto News
Major crypto news as SpaceX revealed its BTC holdings. Hyperliquid tops Solana FDV as Korean funeral firm loses millions on leverage trading. $HYPE $SOL $SPCX
20% of Bitcoin Supply Is Quantum Vulnerable: The Data The post Bitcoin News: Quantum Countdown, The Data Behind the ‘20% Vulnerable’ Bitcoin Supply appeared first
Arm’s growing role in AI infrastructure could significantly boost its market share and revenue, but valuation and dependency risks remain. The post Jefferies bullish on