



Traders are closely watching key support and resistance levels as gold (XAU/USD) remains in a volatile range just above $4,120.
Price action continues to be driven by short-term technical setups and intraday market action. Investors are waiting for direction changes to take place at order blocks and breakout zones.
Gold began the session at the near $4,120 mark and hovered just below the $4,125 mark throughout mid-morning trading. In the 1-day chart, the green and red candles are alternating to form a consolidation pattern, indicating indecision among buyers and sellers.
Price has several times moved through and tested a $4,100 support level without breaking through and has remained above it, thus suggesting a short-term support level.
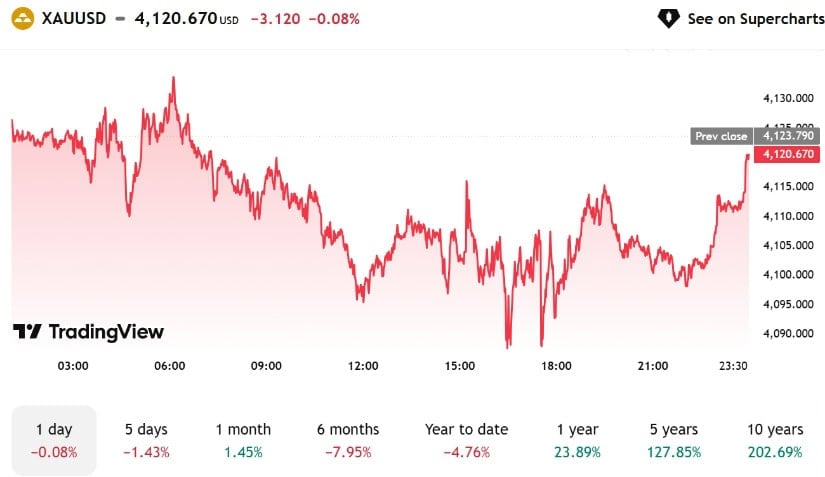
According to TradingView data, intraday highs touched $4,125-$4,130 but found resistance that failed to push it higher. The consolidation is a result of the balance between traders taking speculative trades and traders taking institutional trades, while traders wait for better directional signals. Trading volume was moderate, indicating caution on the market.
RSI has been coming out of oversold conditions on the daily time frame but is still near the neutral zone at 42–45. This means that gold is in neither a strong overbought nor oversold position.
The MACD on the 4-hour time frame exhibits minor bullish crossovers; however, momentum is still weak and hasn’t yet started a run.
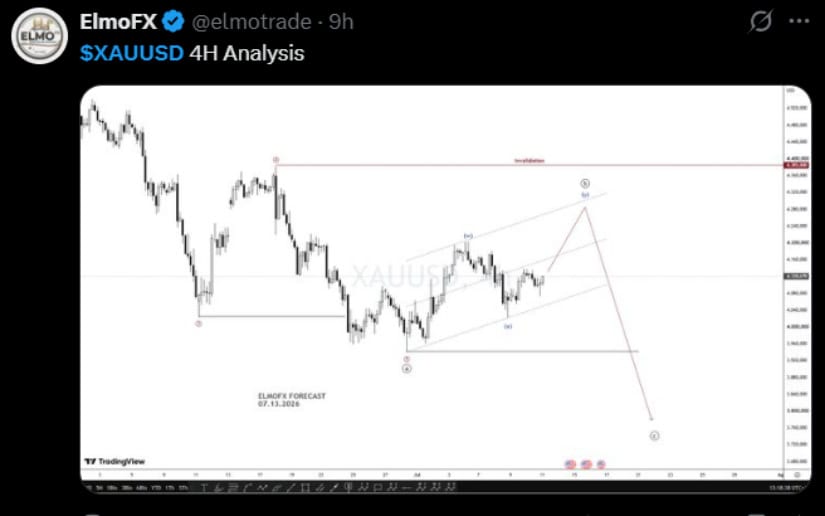
The short-term EMA lines are flattening, and traders are keeping a close eye on them to look for sideways movement. Turning higher could lead to additional gains, but a move lower to $4,100 would challenge longer-term support at $4,080.
A recent chart shows a significant order block in the vicinity of $4,120 – $4,125. This area serves as a level of resistance to upward moves and support to retracements.
The daily chart is shaping up to be a small falling wedge, a pattern that analysts say could be a sign of a breakout if buyers come out in force.
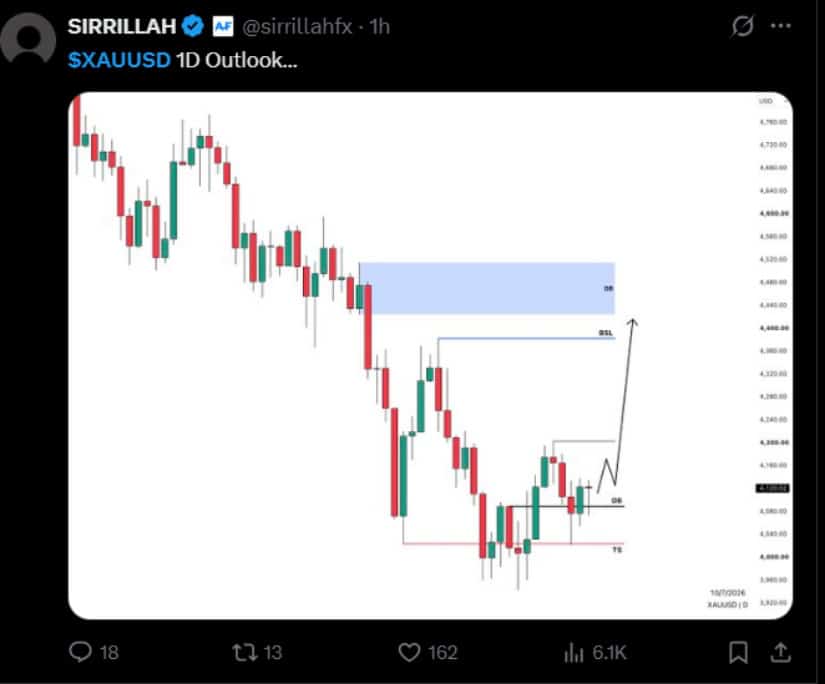
If gold breaks above $4,130, it is heading to challenge $4,150-$4,160 levels, and if it breaks below $4,100, it is heading to retest $4,080.
Trading activity demonstrates a repeated test of these areas, suggesting the market’s participants are taking great care when considering position taking. ST traders should focus on these levels as possible entry/exit points.






Rising US-Iran tensions risk destabilizing global oil markets and hinder diplomatic efforts, increasing uncertainty in the Strait of Hormuz. The post US-Iran tensions rise as
Inner Circle’s qualification highlights the growing opportunities for regional teams to compete on global stages, potentially reshaping the CS2 landscape. The post Inner Circle qualifies
Pickford’s record highlights the disparity between his international success and club challenges, impacting sports betting and fan token markets. The post Jordan Pickford sets England
Jayden Adams’ death highlights the vulnerability of crypto markets to misinformation, emphasizing the need for cautious trading practices. The post Jayden Adams’ death at 25
