

The change has pushed the token into a new resistance area where buyers are now keeping a close eye on $0.13.
A recent X post from Crypto King indicates that HBAR is gaining after months of price drops, breaking above the $0.10 mark. An analyst post indicates that HBAR is gaining after months of price drops, breaking above the $0.10 mark. Based on the analysis, the analyst noted that the $0.10 breakout could be a market structure change.
Meanwhile, the token increased in value to a base around $0.06 at the bottom of the trading day, having made a number of lower highs.
Price subsequently traded sideways around the lower levels where it began a recovery. When the price broke above $0.10, it put the same price mark between the current price and the previous trading range.
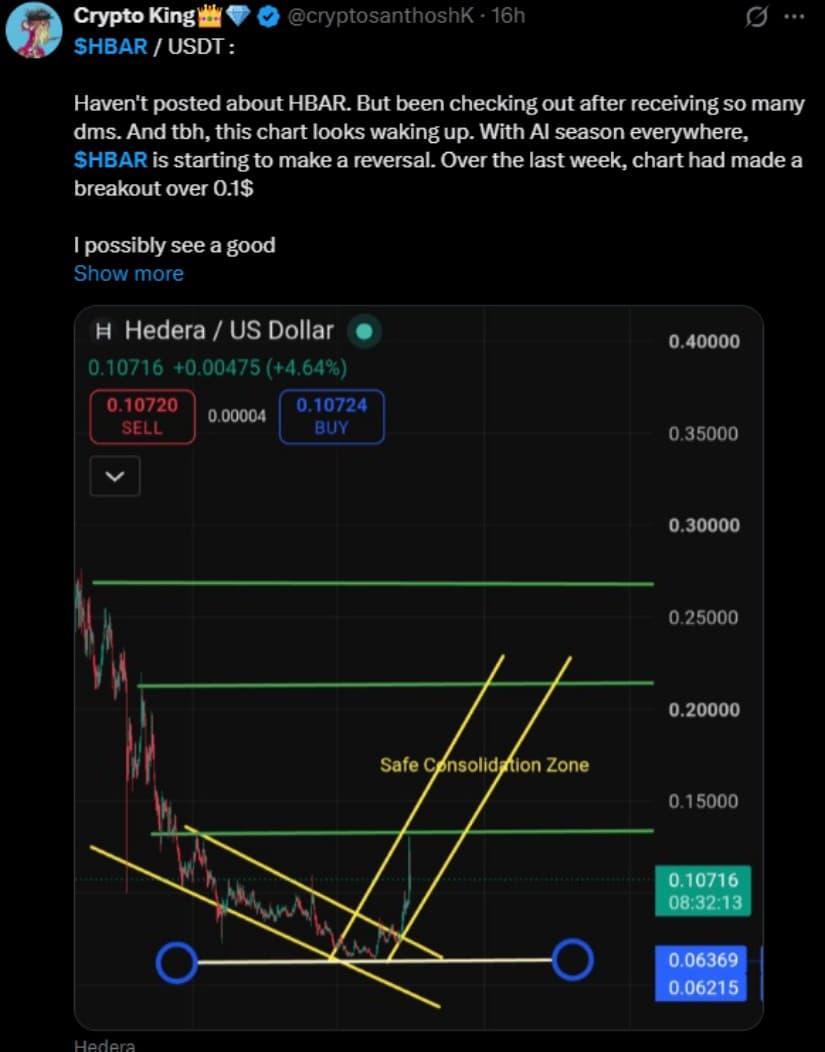 HBAR is on the verge of a break from a long bear market, according to Crypto King’s chart. Source: X
Approx. $0.063 is a significant historical support level. In its previous consolidation period, HBAR was trading around this level, so if selling pressure returns to this area, then it will be a good reference level.
The price of HBAR is approximately 5% over the $0.10 mark. If the breakout structure is missing that threshold, it would not be a recent breakout structure.
Notably, the X chart shows that there is a major resistance around $0.13 above the market. HBAR would have to clear this area to proceed with the recovery towards the next marked level.
Another resistance at $0.21 is indicated on the same chart. If it were to trend toward that area, then it would be a bigger move off the price, and it would need some buying volume.
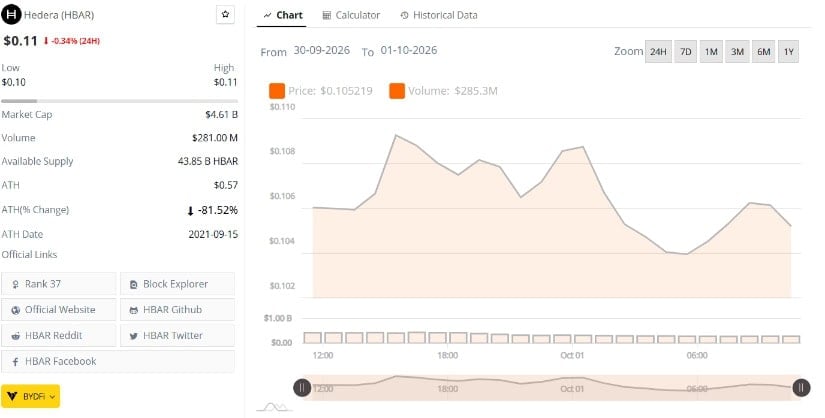 According to data from marketdata, HBAR is trading at around $0.1052, and the 24-hour trading range is roughly 0.10–0.11. Source: BraveNewCoin
Additionally, the asset traded approximately $285.3 million in volume and had a market cap of $4.61 billion.
There is another level of resistance close to $0.27. This price is well above the market and also is in an earlier time frame on the long-term time frame.
HBAR has been trading near $0.1052 as it rallied to $0.109 during the chart time period, as seen on the Brave New Coin chart. Thus, Price has withdrawn from the local high, but remains above $0.10.
The HBAR TradingView chart offers a shorter time frame view of HBAR’s price action. The token was trading around the price of $0.10505 at the time shown, between approximately $0.104 and $0.109 during the session.
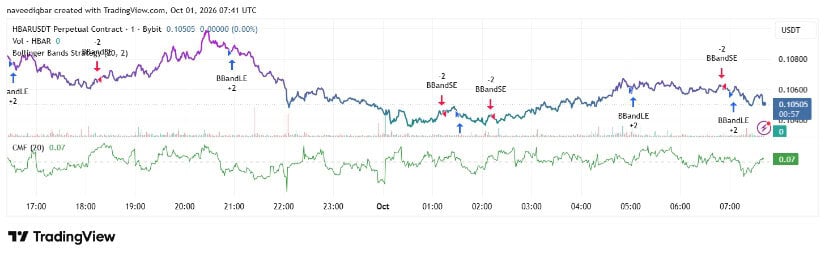 The Bollinger Band signals on the chart indicate several short-term reversals that occurred as HBAR traded in the 0.105-0.107 range. Source: TradingView
Price is currently trading below the recent intraday high, indicating some waning momentum following the recent rally.
The CMF CMI is approximately 0.07. Chaikin Money Flow is around 0.07. The reading is positive, indicating light buying pressure over the period of time shown, but not enough to confirm a bigger trend.
However, caution should be taken in evaluating the overall structure in the short time frame. A one-minute price move is volatile and will not form the longer-term trend.
HBAR is still in the holding pattern above the $0.10 mark, and the next technical level to watch is the $0.13 mark. The longer-term chart of Crypto King shows a $0.21 resistance zone that will be in focus should the price trend above $0.13.
A lack of $0.10 could undermine the current breakout pattern. If so, the token might go back down to lower support levels before making another recovery attempt.
In the X chart, the 0.063-0.062 area is a deeper support zone, indicated by the chart. If they make a move towards this region, they would wipe away much of the recovery and push HBAR back to its previous consolidation range.
The technical structure around HBAR indicates that the cryptocurrency remains above the $0.10 price level, and the next major resistance is at the $0.13 level. At the time of the provided charts, the price was approximately $0.105, which is where the next breakout will occur and either start a more significant recovery or further decline.








