

BraveNewCoin data placed HBAR at $0.09587, down 4.26%, after the price moved between $0.09387 and $0.10 during the session.
Meanwhile, Crypto Tony said he is waiting for a “dip and pump” setup on HBAR. His chart points to a possible support retest before any stronger rebound attempt develops.
Hedera’s latest price action shows a sharp cooldown after the token recently pushed above the $0.10 area. BraveNewCoin data showed HBAR with a market cap of $4.17 billion and a 24-hour volume of $180.02 million.
The token remains far below its all-time high of $0.57, reached on Sept. 15, 2021. At the current price, HBAR trades about 83.07% below that peak. Even so, the token still ranks 33rd by market position on the data shown.
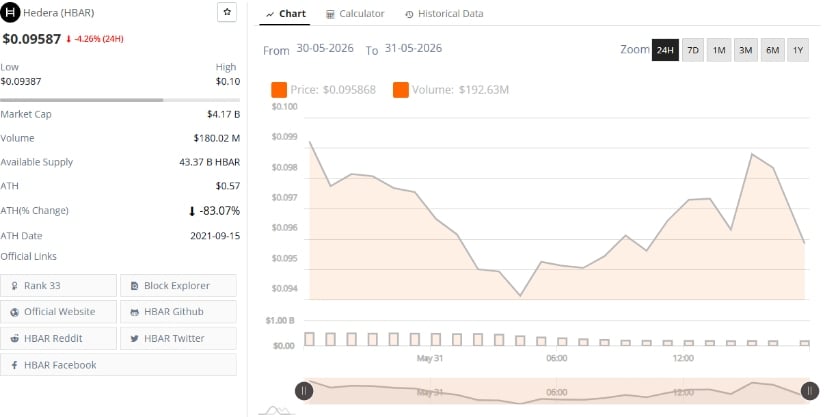
The 24-hour chart shows HBAR falling from near $0.099 before sliding toward the $0.094 region. The price later recovered toward $0.098, then pulled back again near $0.096. This movement suggests that buyers remain active, but sellers still control the upper part of the range.
Crypto Tony’s HBAR/USD chart shows a broader downtrend from previous highs, followed by months of sideways movement near a lower support base. His marked path suggests a possible dip toward support before a larger upside move.
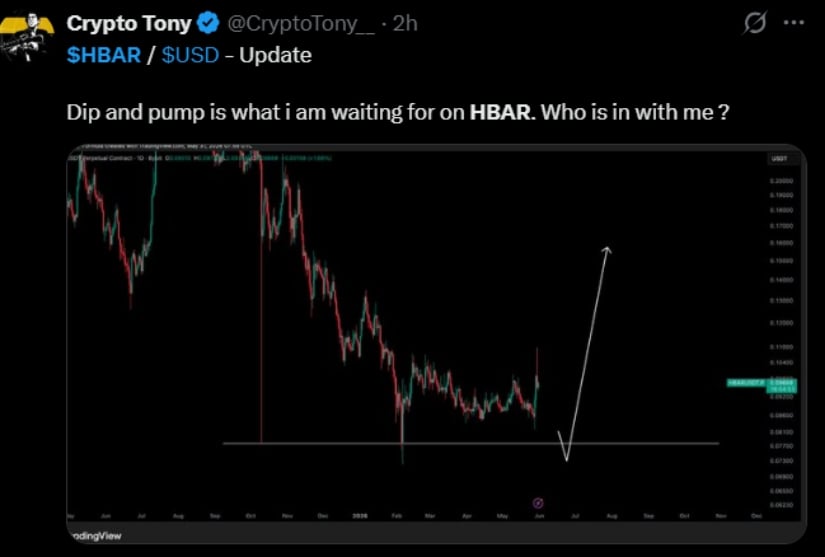
The X chart highlights a key horizontal zone below the current price. If HBAR retests that zone and holds, traders may watch for a stronger rebound. However, a failure below that support would weaken the setup and keep the price under pressure.
Notably, the analyst’s projected move is not confirmed by price action yet. HBAR still needs to hold its base and reclaim short-term resistance before the setup becomes stronger.
This structure fits the current market behavior. The token has already shown a fast rally and pullback pattern, which often creates a decision zone between short-term profit-taking and renewed buying interest.
TradingView data placed HBAR/USDT near $0.09596 at the time of writing. The 30-minute chart showed price below the Bollinger Band middle line at $0.09710, with the upper band near $0.09923 and the lower band near $0.09498.
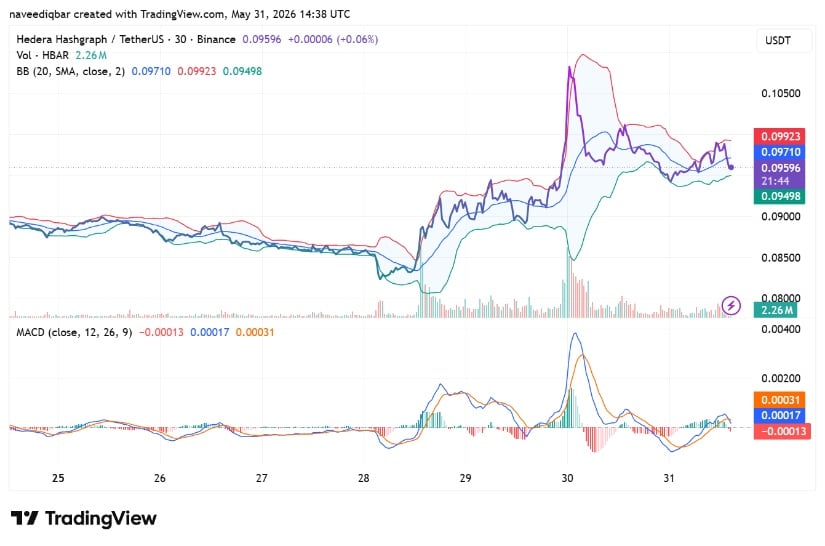
According to TradingView, this means HBAR is trading close to the lower side of its short-term range. A hold above $0.09498 may keep the recovery structure alive, while a drop below that area could open another move toward the BraveNewCoin daily low near $0.09387.
Meanwhile, the MACD showed weak momentum. The MACD line was near 0.00017, slightly below the signal line at 0.00031, while the histogram stayed mildly negative at -0.00013.
For now, HBAR’s main levels remain clear. Buyers need to defend the $0.094 to $0.095 area, while a move back above $0.10 would signal stronger short-term demand.







