
The token has retreated from its previous rally, but a developing falling wedge pattern is raising cautious optimism for a potential recovery toward the $65 region.
HYPE recently traded in the $57–$59 range following a notable intraday decline of more than 7% at one point, marking a clear cooling phase after earlier bullish momentum. The correction has been widely described by analysts as a “summer phase,” reflecting a period of consolidation and distribution after a strong upward trend.
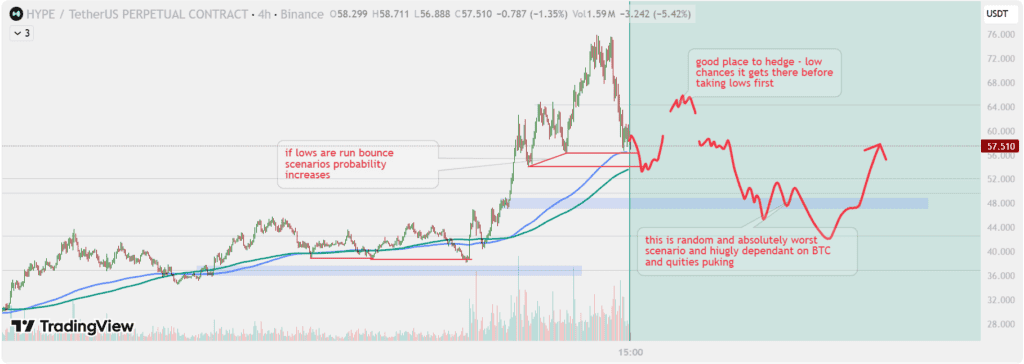
HYPE is in a corrective “summer” phase after a strong rally, with analysts favoring short-side setups over near-term upside. Source: OvidiuPublius on TradingView
According to a TradingView-based short-biased analysis titled “HYPE summer,” the market structure suggests fading momentum after rejection from higher resistance zones. The report highlights that price action has shifted from an expansion phase into a corrective structure, with short-term weakness becoming more visible.
Despite the pullback, longer-term context still reflects a broader uptrend that has not been fully invalidated.
One of the most closely watched developments is the appearance of a falling wedge pattern on lower timeframes. In a recent X post shared by crypto analyst @cryptowithgopal, $HYPE is described as forming a “classic falling wedge on the 15-minute chart,” with converging lower highs and slowing downside momentum.
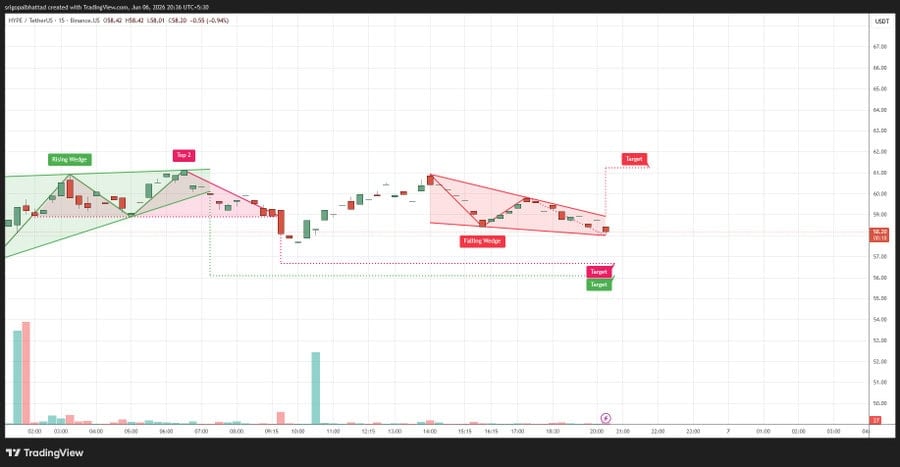
$HYPE is forming a falling wedge pattern with weakening bearish momentum, as buyers appear to be defending key support levels ahead of a possible breakout attempt. Source: Crypto With Gopal via X
This structure is often monitored by traders because it can signal exhaustion in selling pressure. However, confirmation typically requires a breakout above the upper trendline with increased volume.
At present, the wedge structure suggests buyers may be gradually defending lower levels rather than allowing a deeper breakdown.
Market structure analysis points to several important zones that continue to define short-term sentiment:
A break and sustained close above $65 is widely viewed as a key condition for shifting sentiment back toward bullish continuation. Conversely, failure to hold the $56–$58 range could expose the token to deeper retracement zones.
Broader technical readings from TradingView show a market in equilibrium rather than a clear directional trend.
Oscillator-based indicators, including RSI (14), Stochastic %K, CCI (20), MACD, and Williams %R, are largely unavailable or neutral in aggregate summaries. The overall oscillator category is currently rated Neutral, indicating a lack of strong momentum either toward continuation or breakdown.
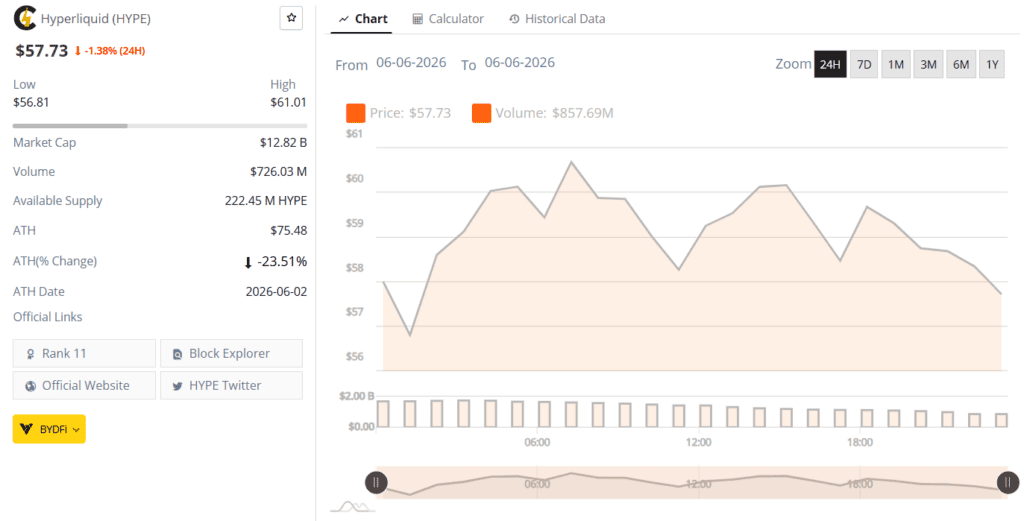
Hyperliquid (HYPE) was trading at around $57.73, down 1.38% in the last 24 hours at press time. Source: Brave New Coin
However, moving averages present a slightly more constructive picture. Despite the recent pullback, the overall moving average classification is still leaning toward a bullish bias, suggesting that medium-term trend structure has not fully turned bearish.
This divergence between neutral momentum indicators and supportive moving averages often reflects a transitional phase in price action, where the market is attempting to establish a new equilibrium after volatility.
Earlier in the year, HYPE experienced a strong upside move that pushed the token toward the $65–$75 range before encountering heavy rejection. Since then, price action has transitioned into a corrective phase marked by:
The “HYPE summer” framework described by analysts reflects expectations of continued consolidation unless buyers regain control above resistance.
At this stage, Hyperliquid (HYPE) sits at a technical crossroads. The falling wedge formation offers a potential bullish setup, but confirmation is still required through a clear breakout above resistance levels.
For now, market participants remain focused on whether $56–$58 support holds or if price action weakens further toward lower liquidity zones. A recovery above $65 would likely mark the first meaningful signal that the correction phase may be ending.
Until then, the structure remains neutral-to-cautious, with traders closely monitoring whether current consolidation evolves into a reversal or another leg lower.


XRP price dipped 3% last week. It now trades in the $1.30 to $1.40 range. That is frustrating for holders.But something else is happening around
Banks Pitch Tokenized Deposits as CBDC Alternative The post JPMorgan, Citi, and Bank of America Just Built a Tokenized Payment Network to Kill Stablecoins appeared
Gold and silver have shed a combined trillion dollars in market value from their January peaks, with gold trading near $4,331 per ounce and silver
The semiconductor sector’s sharp decline signals potential volatility and reevaluation of AI-driven growth expectations amid rising interest rates. The post PHLX Semiconductor Index plunges 10%,