MemeCore (M) jumped 25% on Tuesday to reclaim $3.38 after retesting the 0.382 Fibonacci support at $2.59, signaling that buyers stepped back at the key correction level.
The bounce drives M into a thin liquidity pocket near $3.40, where short liquidation clusters start stacking. A clean break opens the path toward $3.88 and potentially $4 in the coming sessions.
The M Exchange Liquidation Map from Coinglass reveals dense short positions beginning at $3.49 and thickening between $3.69 and $3.88. A second wave sits higher at $4.05 to $4.27.
Long liquidation pockets below price concentrate at $2.51 to $2.60, forming the biggest magnet zone on the 30-day map. That same area triggered the prior reversal when leveraged longs got flushed.
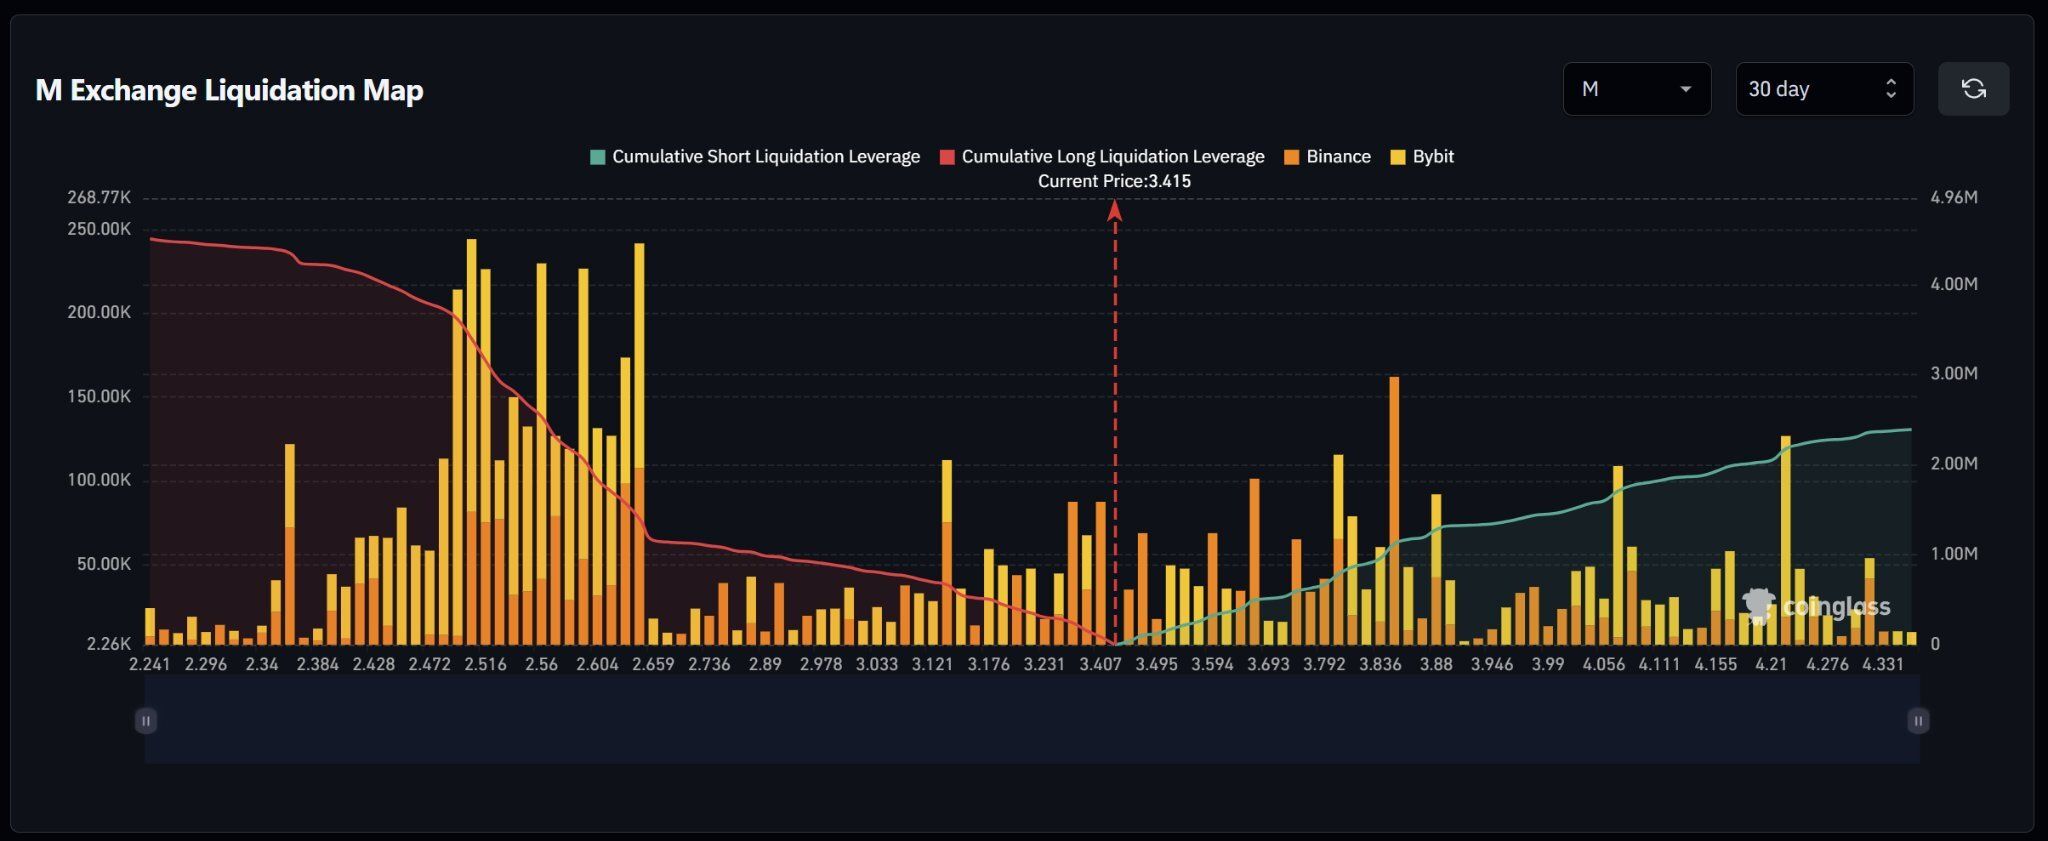
According to analyst @ScalpingX, the current price at $3.41 sits inside a thin liquidity layer between $3.40 and $3.50. A clean break above $3.50 could accelerate the move toward $3.88 first, then extend to $4.27.
Holding the $3.41 pivot remains the bullish trigger. Losing it shifts the bias to $3.12, with the deeper magnet zone at $2.60 becoming the next downside target.
The 4-hour timeframe confirms aggressive spot buying at the $2.65 low, where M printed a 39% green bar on the highest volume reading of the past 30 days.
However, price stalled at $3.68, a level that acts as both flipped support-turned-resistance and the 0.618 Fibonacci retracement of the recent decline. The move mirrors the prior rally that lifted M back toward its all-time high.
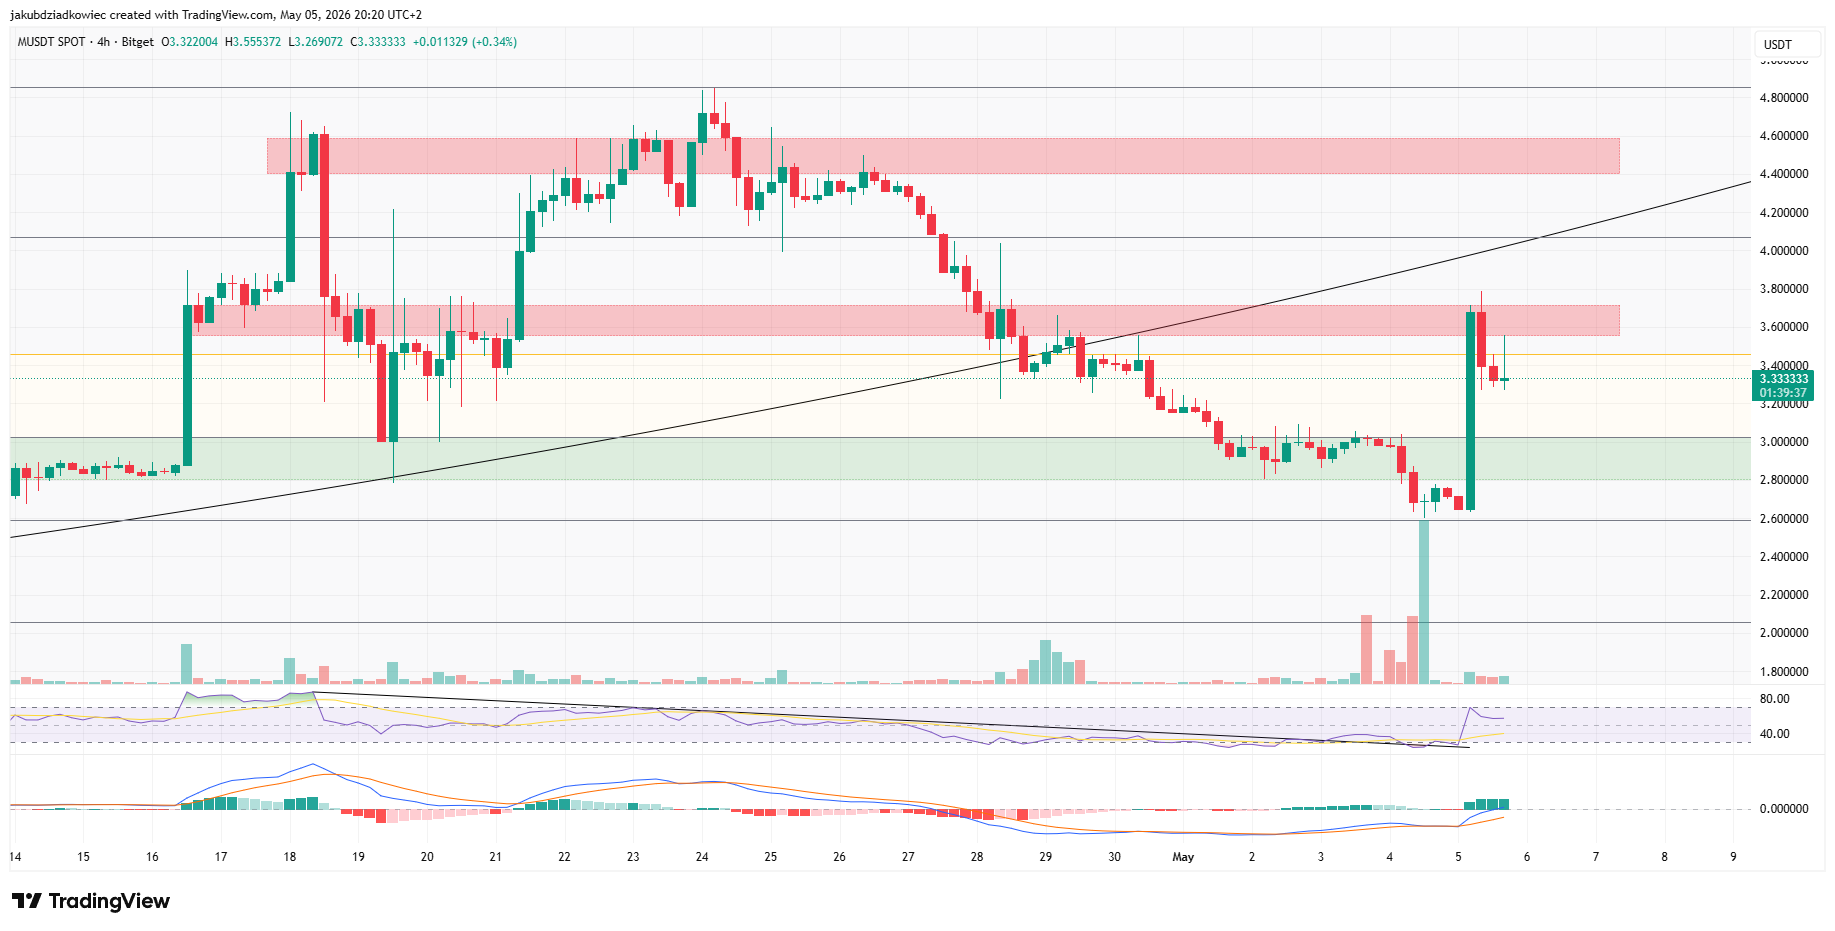
RSI has reclaimed the 50 line and entered bullish territory without reaching overbought, leaving headroom for continuation. MACD flipped positive with growing green histogram bars across recent candles.
A 4-hour close above $3.68 unlocks $4.50 as the next mid-term target. Rejection here returns M to the $2.60 demand zone, aligning with the deepest long liquidation cluster on the 30-day map.
The daily chart shows a textbook retest of the parabolic ascending curve. M tagged the 0.382 Fib at $2.59 on May 4 with a record-volume spike, then bounced 25% the next session with a wick into the 0.618 Fib at $3.46.
A daily close above $3.46 opens the 0.786 Fib at $4.07 as the first major target, followed by the all-time high near $4.86. The break from the parabolic curve was expected and now leaves a healthier base structure in place.
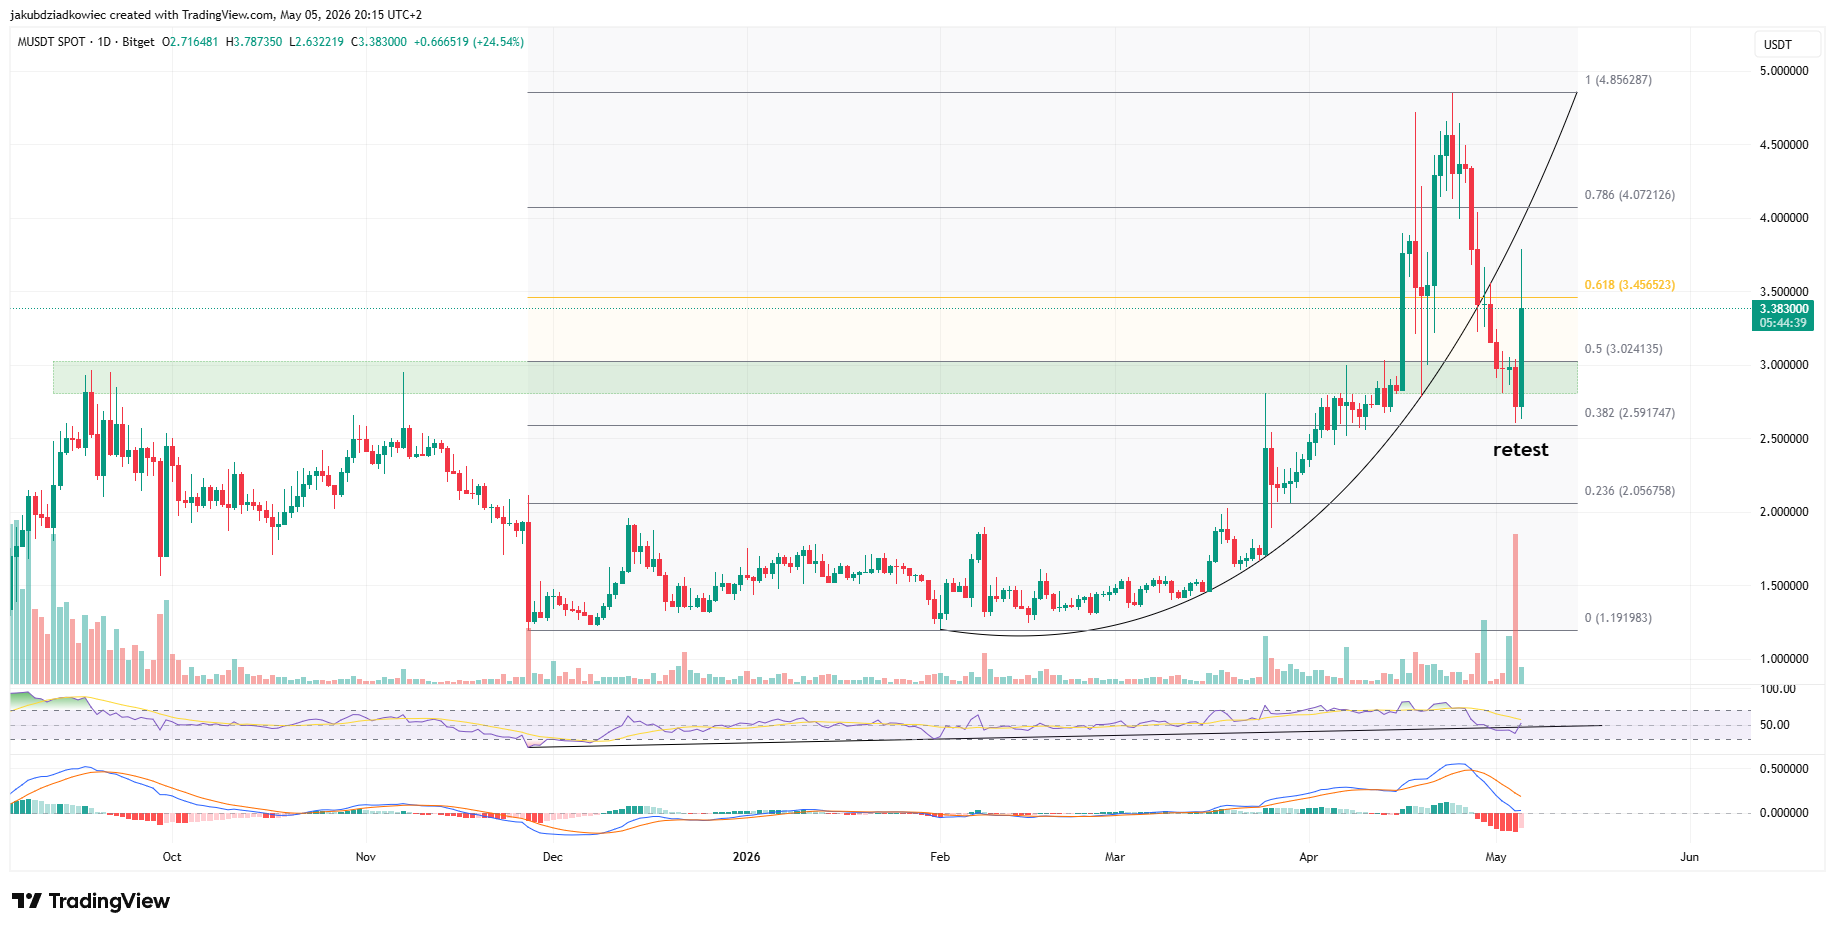
Daily RSI has reset from overbought conditions and is now curling back up. MACD remains in negative territory, but the histogram has begun turning higher, suggesting downside momentum has run its course.
Invalidation sits at the $2.60 horizontal support. A break below that level cancels the bullish thesis and reopens the $2.05 zone, the 0.236 Fib retracement, echoing prior on-chain warning signs that flagged demand exhaustion.
The 30-day liquidation map suggests this binary outcome resolves quickly. With thin liquidity above and a magnet zone below, M is set up for a sharp move once the $3.68 pivot decides direction.
The post MemeCore (M) Rebounds 25% Off 0.382 Fib, Eyes $4 Breakout appeared first on BeInCrypto.


The pace of digital markets is accelerating rapidly, and many users no longer debate whether artificial intelligence should venture into the realm of trading; instead,
Zano is set to open native ZANO to EVM networks, TON, and Solana through a non-custodial bridging mechanism tied to its upcoming Hard Fork 6,
The rising demand for US cloud services underscores the strategic importance of AI in maintaining technological dominance amid global competition. The post OpenAI, Anthropic drive
Starmer’s leadership faces scrutiny, potentially reshaping Labour’s future and influencing UK political dynamics amid electoral challenges. The post UK elections may test Starmer’s leadership amid