


However, Cooper warned that he does not fully trust early moves before New York opens. He said the drops could still reverse during the day, so traders are watching whether the current declines hold after U.S. markets become active.
Gold showed the weakest short-term structure among the charts Cooper shared. The metal fell back below the upper orange trendline, which had supported the bull flag idea in recent sessions.
The daily gold chart showed price trading near $4,561 after a drop of about 1.88%. Gold had already been compressing inside a narrowing structure, with resistance near $5,092 and lower support near $4,381.
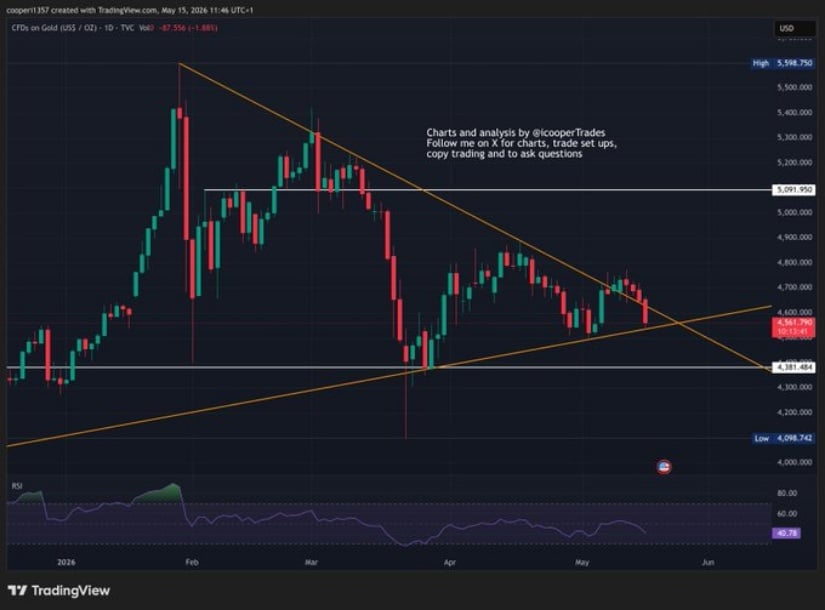
Cooper said the bull flag now looks to be failing after the price lost the upper orange line. Still, he remained neutral while gold held the lower orange support line.
A break below that lower line would turn the short-term setup bearish. On the other hand, a recovery back above the upper orange trendline would put the bullish case back in play.
Silver dropped sharply, but its chart still looked stronger than gold’s structure. Cooper said silver remained above the upper orange trendline, which means the short-term bias stayed slightly bullish.
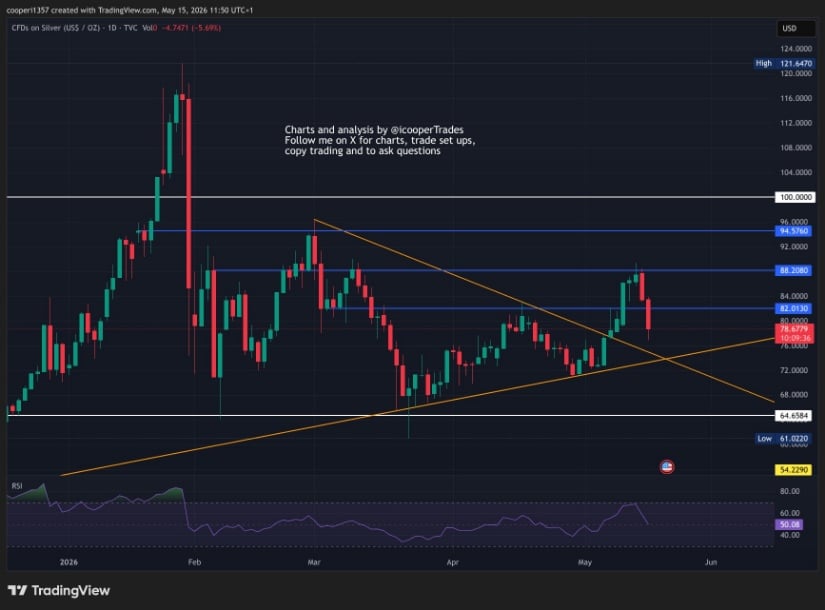
The silver chart showed a price near $78.67 after a 5.69% decline. The metal pulled back from the $88.20 resistance area, with higher levels marked at $94.57 and $100.
Despite the drop, silver still held above the rising orange support structure. Cooper said a retest of that level could become a day-trade long setup if the market reacts well.
The key issue is whether silver can defend the trendline after the sell-off. A hold would keep buyers in control, while a breakdown could bring the $64.65 support region back into focus.
Copper tagged the $6.32 support level after its latest pullback. Cooper said he remained short on his swing trade, although he also took a smaller day-trade long from that support with a trailing stop.
The copper chart showed a price near $6.38 after falling from the recent high near $6.73. The metal remains inside an upward channel, but the rejection from the upper zone shows buyers lost momentum near resistance.
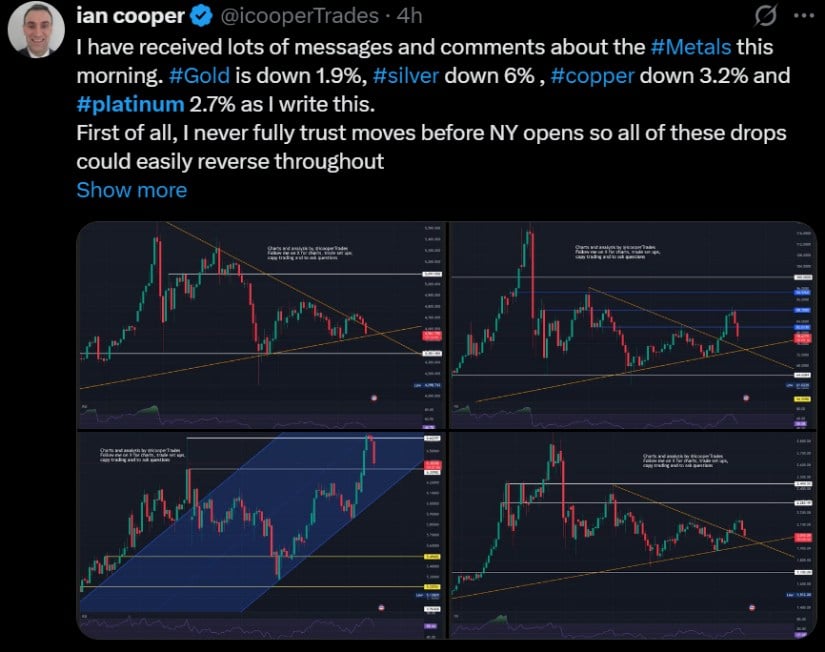
Platinum also tested its orange trendline. The chart showed a price near $2,019 after a 2.37% decline, with resistance levels marked near $2,328 and $2,444.
Cooper said the same logic applies to platinum as it does to gold and silver. Holding the orange line keeps the setup stable. Losing it would weaken the structure and shift attention toward the $1,700 support zone.


Trump’s rejection of Iran’s proposal heightens Middle East tensions, impacting global energy markets and diplomatic stability. The post Trump calls Iran’s latest nuclear proposal ‘unacceptable,’
Crypto pundit Pumpius has revealed how the CLARITY Act represents a “massive” win for XRP with key provisions to protect its ecosystem. He also alluded
Dogecoin continues to show signs of recovery as bulls gradually push prices higher from recent lows. However, despite the improving momentum, the broader market structure
Decentralized exchange Hyperliquid has become a popular destination for speculating on oil prices.