
His comments come as Bitcoin struggles to regain momentum after falling toward the $60,000 level, while traders weigh broader market weakness, declining technical indicators, and recent scrutiny surrounding Strategy’s sale of a small portion of its Bitcoin holdings.
Saylor pushed back against suggestions that Strategy’s recent Bitcoin sale contributed meaningfully to the market’s decline. Instead, he pointed to what he described as a large-scale capital shift into artificial intelligence infrastructure projects.
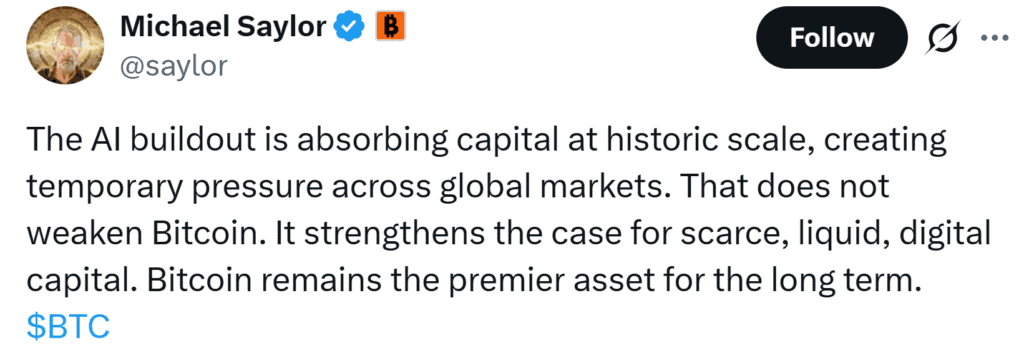
Saylor said the AI investment boom is temporarily diverting capital from markets but believes it ultimately reinforces Bitcoin’s long-term value as a scarce and liquid digital asset. Source: Michael Saylor via X
In a post on X, Saylor argued that the rapid expansion of the AI industry is temporarily absorbing global investment capital that might otherwise flow into traditional financial assets and cryptocurrencies.
“This is capital rotation,” Saylor said, explaining that investors are directing funds toward emerging opportunities in artificial intelligence before eventually reallocating capital elsewhere.
During a public appearance highlighted in a CNBC interview, Saylor cited major fundraising rounds and infrastructure spending within the AI sector, including reports of multibillion-dollar investments in companies such as Anthropic. He also referenced large corporate transactions and Bitcoin ETF activity as examples of how liquidity continuously moves between sectors.
Despite the near-term pressure, Saylor maintained that Bitcoin’s core investment thesis remains unchanged. He described the asset as “scarce, liquid digital capital” and suggested that periods of capital migration into fast-growing industries may ultimately reinforce Bitcoin’s value proposition as a long-term store of value.
Investor concerns intensified after Strategy disclosed that it sold 32 BTC between May 26 and May 31 for approximately $2.5 million, marking the company’s first Bitcoin sale since 2022.
The transaction was completed at an average price of roughly $77,135 per Bitcoin and was used to help fund dividend obligations tied to the company’s preferred stock program. According to an SEC filing, Strategy still holds 843,706 BTC, maintaining its position as the largest corporate Bitcoin holder globally.

Strategy sold 32 BTC for roughly $2.5 million between May 26–31, its first sale since 2022, using the proceeds to fund preferred-stock dividends while retaining 843,706 BTC, according to an SEC filing. Source: The Bitcoin Historian via X
The sale attracted significant attention because Saylor has spent years advocating a “never sell Bitcoin” philosophy. However, many market participants noted that the transaction represented only about 0.0038% of the company’s total Bitcoin reserves.
Several analysts and industry observers characterized the sale as operational rather than strategic, arguing that it does little to alter Strategy’s broader accumulation-focused approach.
While headlines surrounding Strategy generated discussion, Bitcoin’s recent weakness appears more closely tied to broader market conditions and a deteriorating technical structure.
Bitcoin is currently trading around the $60,600-$61,000 range after an extended pullback that pushed prices well below several key moving averages.
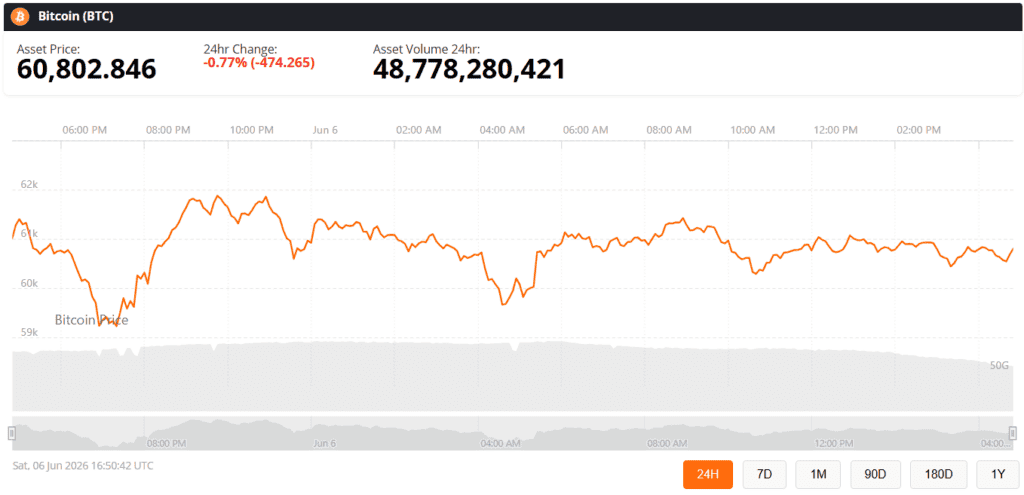
Bitcoin (BTC) was trading at around $60,802, down 0.77% in the last 24 hours at press time. Source: Bitcoin price via Brave New Coin
According to TradingView technical data, the overall market outlook remains cautious. Combined indicators currently show 14 sell signals, nine neutral readings, and only three buy signals, resulting in an overall “sell” rating. Both the one-week and one-month outlooks also continue to signal bearish conditions.
The data suggests that sellers remain in control despite signs that Bitcoin may be approaching oversold territory.
Several momentum indicators show Bitcoin trading at historically weak levels.
The Relative Strength Index (RSI-14) stands near 15, a level generally associated with heavily oversold market conditions. Stochastic %K is around 11, while Williams %R has dropped to approximately -91, further highlighting the intensity of recent selling pressure.
At the same time, the Commodity Channel Index (CCI-20) has fallen to -177 and the Momentum indicator sits near -13,498. Both currently generate buy signals, suggesting that downside momentum may be becoming exhausted in the short term.
However, not all indicators support a bullish interpretation. The MACD remains firmly negative at approximately -3,922, continuing to produce a sell signal. Meanwhile, the Average Directional Index (ADX) near 42 indicates a strong trend environment, although it does not identify direction.
Taken together, these readings suggest Bitcoin could experience temporary relief rallies, but technical evidence for a sustained trend reversal remains limited.
The strongest bearish signals currently come from Bitcoin’s moving averages.
Nearly every major exponential and simple moving average remains above the current market price. The 10-day EMA sits around $66,933, while the 10-day SMA is approximately $68,184. Longer-term trend indicators paint a similar picture, with the 200-day EMA near $80,089 and the 200-day SMA around $78,618.
Because Bitcoin remains significantly below these levels, analysts view the broader trend as negative until key resistance zones are reclaimed.
The Hull Moving Average is one of the few indicators currently generating a buy signal, while the Ichimoku Base Line remains neutral.
Independent chart analysis shared by market analyst mohamadvalizibayi suggests Bitcoin remains trapped inside a descending channel characterized by lower highs and lower lows.
The analyst noted that a previously bullish Failure to Return (FTR) zone has already been lost, which is often interpreted as a sign that sellers retain control of market structure. New FTR formations have since emerged within the ongoing downtrend.
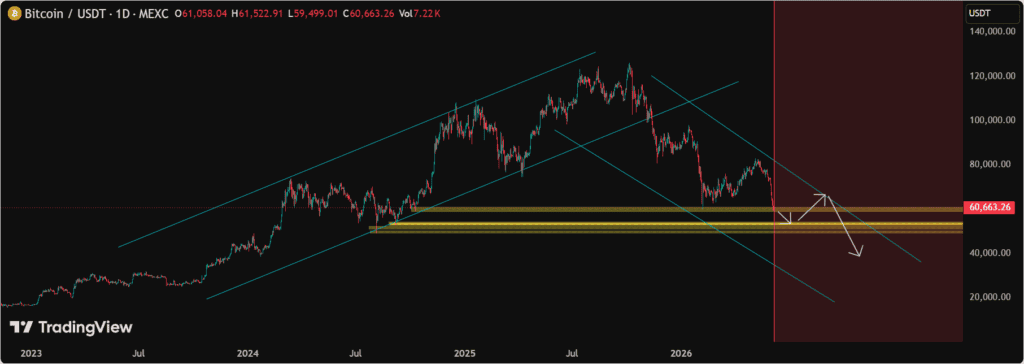
Bitcoin remains in a bearish descending channel, with the loss of a key bullish FTR zone signaling continued downside risk despite potential support reactions at highlighted demand areas. Source: mohamadvalizibayi on TradingView
Several highlighted support areas near the current $59,000-$61,000 region may provide temporary relief if buyers step in. However, failure to defend these zones could expose Bitcoin to further downside toward the mid-to-high $50,000 range.
On the upside, resistance remains concentrated near the channel’s upper boundary, which is estimated to sit between approximately $62,000 and $65,000.
For now, analysts generally agree that Bitcoin’s outlook remains bearish until the asset breaks above the descending channel and reclaims key resistance levels with strong volume.
As capital continues flowing into rapidly expanding sectors such as artificial intelligence, Bitcoin investors are watching closely to determine whether the recent weakness represents a temporary rotation of liquidity or the beginning of a deeper correction. For the moment, technical indicators suggest caution remains warranted as BTC attempts to hold above an increasingly important support zone near $60,000.


Sam Altman ChatGPT AI Predicts Wild Bitcoin Price by End of 2026 The post Sam Altman ChatGPT AI Predicts Wild Bitcoin Price by End of
Indonesia’s centralized export control could reshape global commodity markets, boosting state revenue but potentially raising import costs. The post Indonesia centralizes strategic commodity exports under
The robust job growth may deter the Fed from cutting rates, impacting risk assets like crypto by making safer investments more appealing. The post US
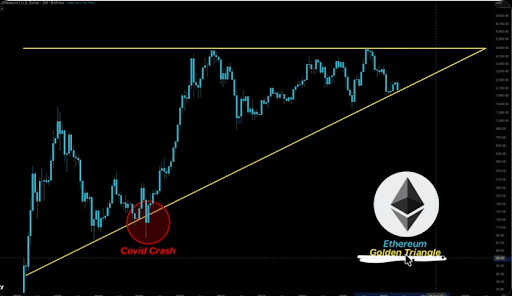
Technical analysis of the 3-week chart outlook shows ETH pressing into the apex of a golden triangle formation that has survived the Covid crash, the