


Solana price is trying to recover after one of its sharpest downside phases in recent months. Brave New Coin data shows that Solana price is trading near $64.85 after bouncing from the $60 region, while its 24-hour gain showed buyers attempting to regain control after heavy selling pressure.
Solana’s latest price action shows a clear recovery attempt after the market tapped the $60 area. The move has lifted SOL back towards the mid-$60s, with the price trading around $64.85 and gaining more than 5% over the last 24 hours.
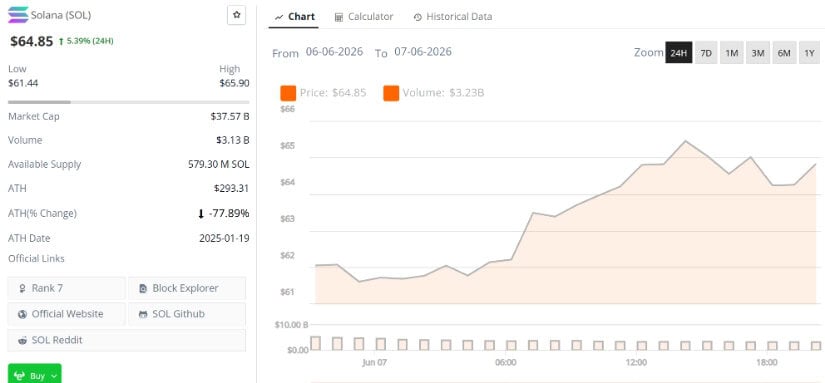 Solana price trades at $64.85, up 5.39% in the last 24 hours. Source: SOL price via Brave New Coin
That recovery matters because $60 is now becoming the first major psychological support zone. If buyers continue defending this area, SOL could attempt a stronger move towards $70 and then $76. However, if the bounce loses strength, traders may start treating this move as only a temporary reaction after an aggressive sell-off.
The short-term bearish case is still active. Crypto Tony’s chart shows SOL breaking down sharply and then moving back towards a key retest zone. The concern here is that the price may revisit the broken support area before rejecting again.
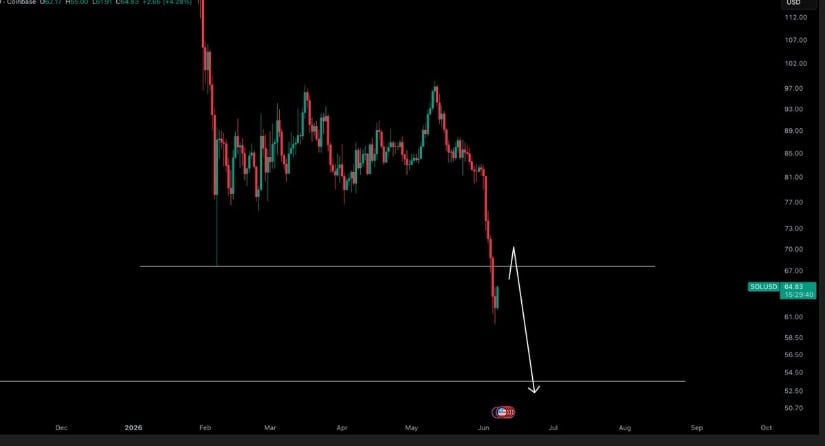 Solana’s retest zone remains key as SOL risks another rejection towards $55–$58 if bulls fail to reclaim $70–$76. Source: Crypto Tony via X
This makes the $70–$76 region very important. If SOL fails to reclaim that area with strength, the chart could still open another move lower. The downside map on the chart points towards the lower support region around $55–$58 if the retest turns into another rejection.
The larger context is also becoming extreme. Ash Crypto pointed out that SOL recently hit a three-year low near $60, is down more than 80% from its all-time high, and has printed eight consecutive red monthly candles for the first time in its history.
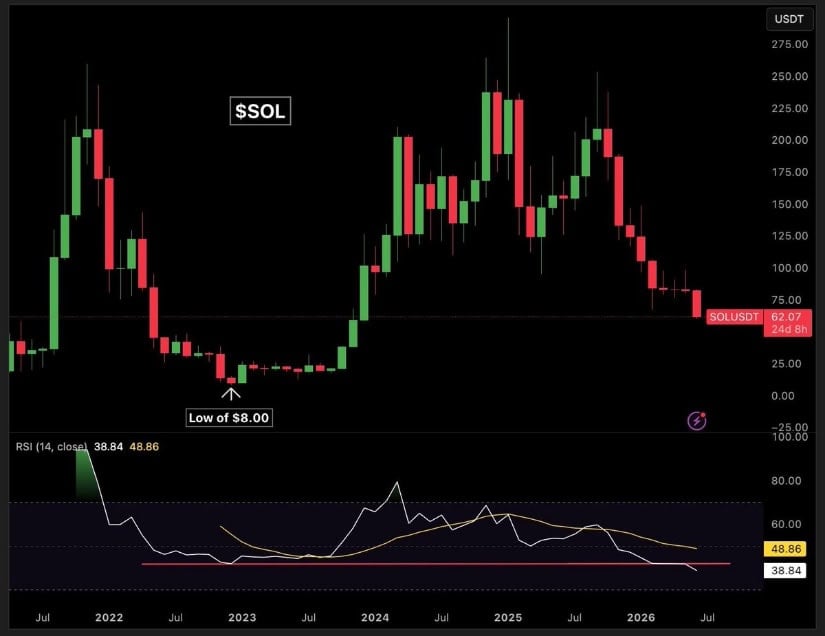 Solana’s monthly chart shows extreme oversold conditions as SOL drops near $60 after eight straight red monthly candles. Source: Ash Crypto via X
That does not automatically confirm a bottom, but it does show how stretched the sell-off has become. The monthly RSI is now more oversold than it was during the 2022 FTX crash, when SOL collapsed towards $8.
Some traders are treating this weakness as an opportunity instead of a breakdown-only setup. Rod’s chart shows SOL inside the manipulation range between $50 to $40.
The chart suggests that if SOL Solana price can hold this region and start building a base, a larger recovery towards $175 could become the bigger upside target.
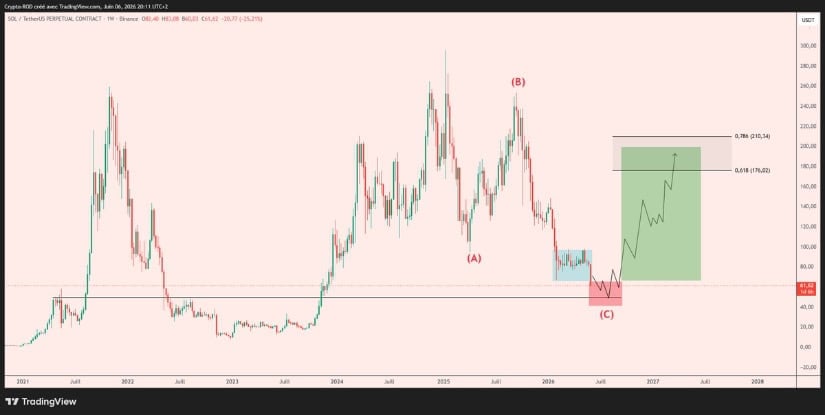 Solana’s $50–$40 range is being watched as a major accumulation zone, with a potential recovery target near $175 if buyers build a strong base. Source: Rod via X
Solana’s weakness is not only visible against the dollar. The SOL/BTC pair is still trading near a major support region after a long decline. Trader Symba noted that SOL may remain weak against Bitcoin for now, but the chart also suggests the pair is approaching an important long-term demand zone.
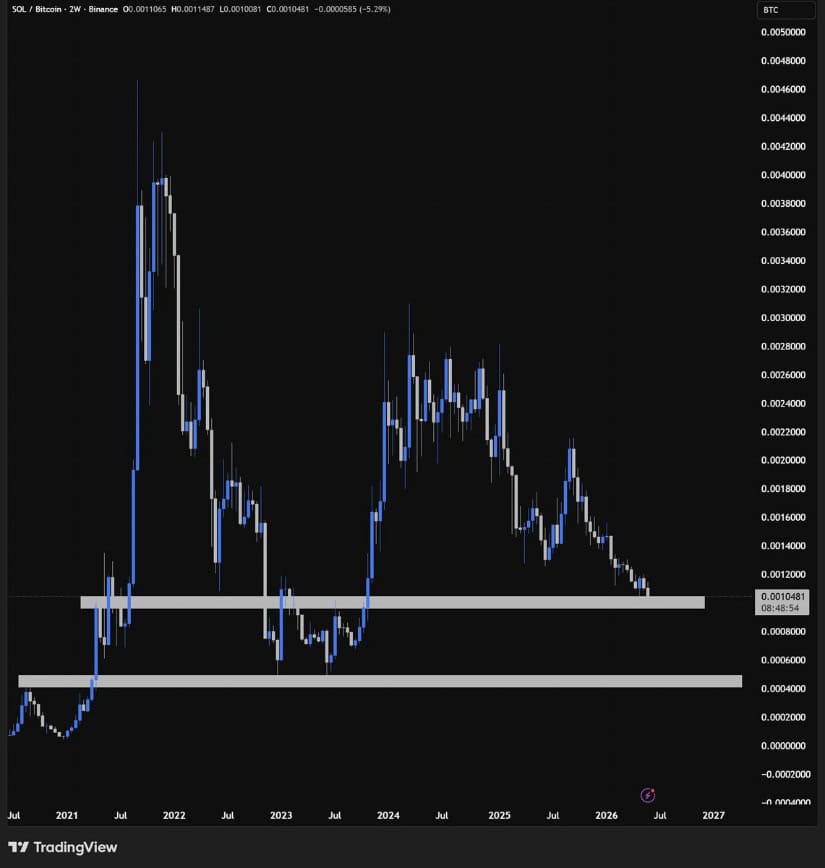 SOL/BTC remains weak near long-term support, but holding this demand zone could signal a bigger Solana bottom forming. Source: Trader Symba via X
This matters because SOL/BTC usually gives a better view of Solana’s relative strength. If this pair continues bleeding, SOL may struggle a little longer. However, if SOL/BTC holds near the current support band, it could signal that the Solana price is close to forming a relative bottom. Symba’s longer-term view still points towards new highs above $300.
There is also a short-term bullish signal developing. CryptoJack highlighted that SOL has broken above a descending trendline on the 1H chart. This is the first sign that immediate downside momentum may be cooling after the recent crash.
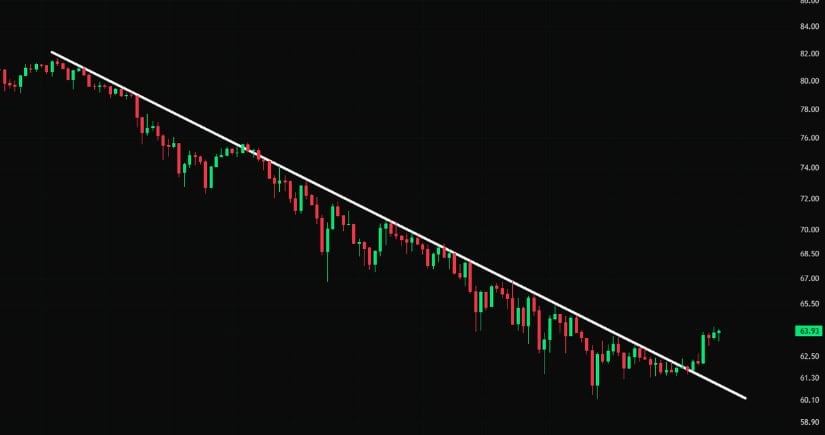
Solana’s 1H breakout above the descending trendline. Source: CryptoJack via X
The breakout is useful, but it still needs follow-through. SOL must hold above the broken trendline and avoid falling back below the $62–$63 area. If buyers defend the breakout, the next upside levels to watch are $68, $70, and then the larger $76 resistance area.
Solana is now in a very sensitive area. The short-term chart is trying to recover, but the broader market still carries heavy damage after months of red candles and a sharp move towards the $60 region.
Still, this is exactly where the setup becomes interesting. Oversold readings, long-term support tests, and early trendline breakouts are all appearing at the same time. That does not guarantee an immediate reversal, but it does show that SOL is no longer in a normal pullback phase.
If buyers can keep defending the $60 region, Solana may be entering a major reset zone before a larger recovery attempt. Until then, the market remains cautious, with $60 as the key support and $70–$76 as the first major recovery test.


Rising rate hike expectations could shift investment from volatile assets to safer options, impacting crypto and high-volatility markets. The post US jobs report fuels bets
With bitcoin prices sliding to levels not witnessed since February, the network’s hashrate has undergone a steep contraction, with 145 exahash per second (EH/s) exiting

Why you should listen Wilson’s pitch is a contrarian one: the best place to keep gold may be exactly where it already is. Billions of
Solana co-founder Anatoly Yakovenko has publicly challenged Senator Bernie Sanders warning that artificial intelligence (AI) and robotics could eliminate millions of American jobs. The debate