
Solana started a fresh increase above the $90 zone. SOL price is now consolidating and might aim for more gains above the $96 zone.
Solana price started a decent increase after it settled above the $88 zone, outperforming Bitcoin and Ethereum. SOL climbed above the $92 level to enter a short-term positive zone.
The price even smashed the $95 resistance. A high was formed at $96.85, and the price is now consolidating gains. There was a minor decline toward the 23.6% Fib retracement level of the recent upward move from the $87.61 swing low to the $96.85 high.
Solana is now trading above $92 and the 100-hourly simple moving average. Besides, there is a bullish trend line forming with support at $92.20 on the hourly chart of the SOL/USD pair.
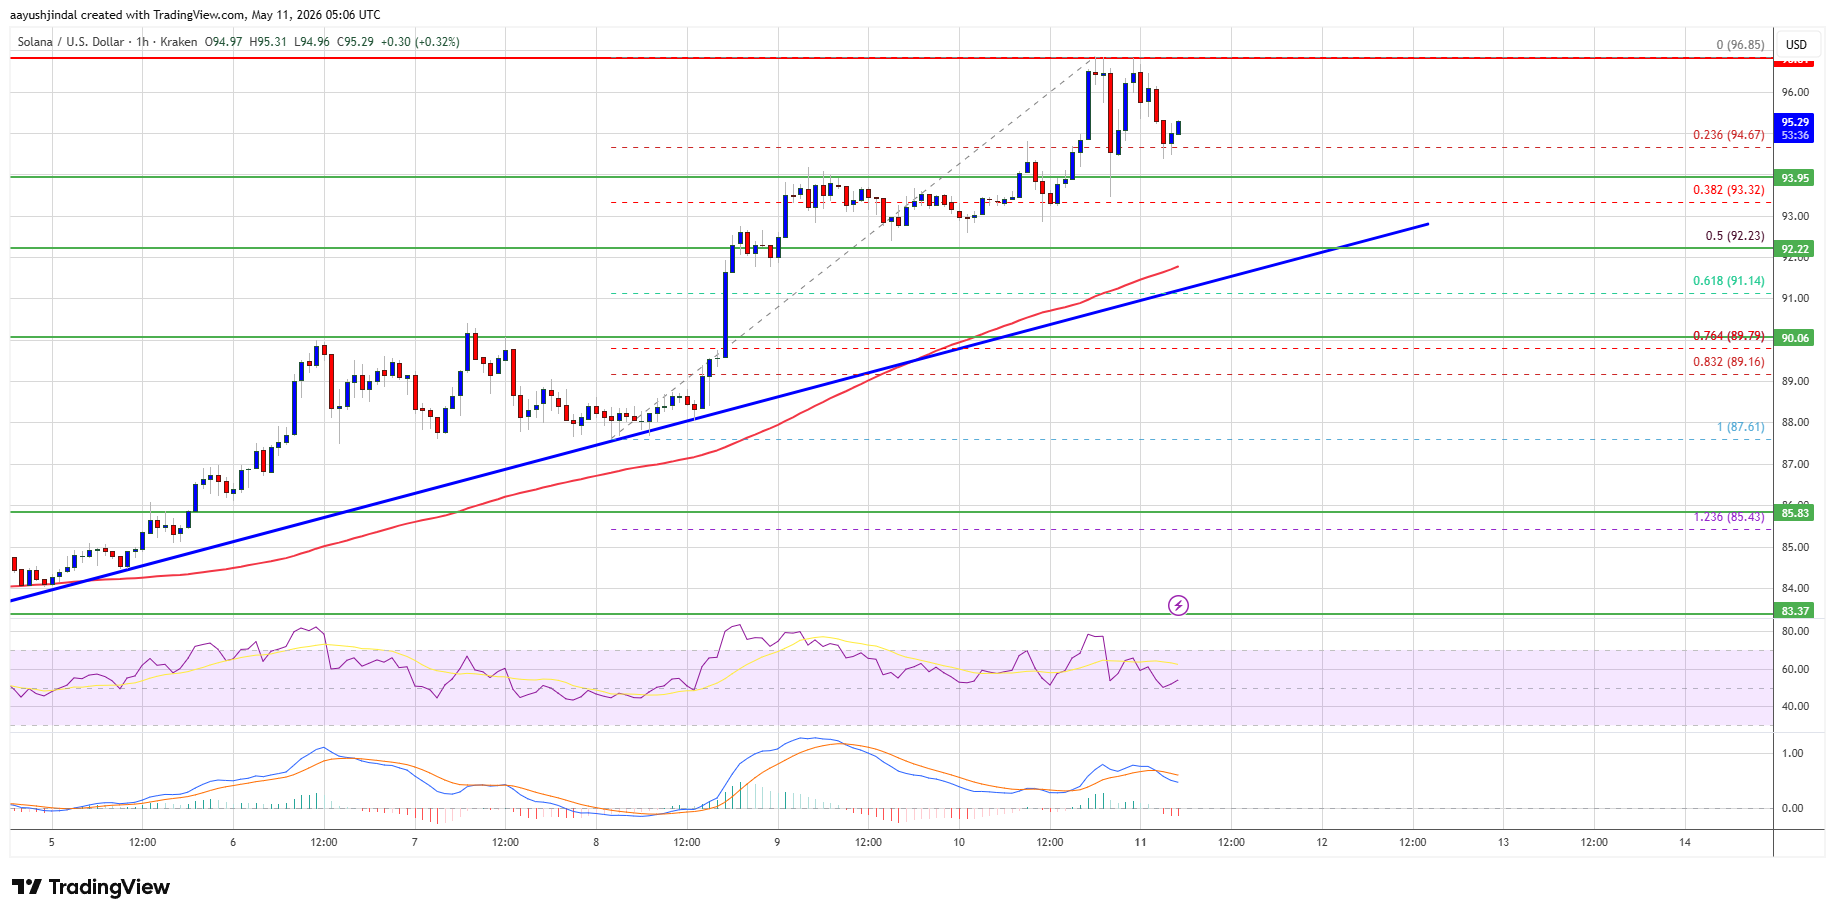
On the upside, the price is facing resistance near $96.20. The next major resistance is near the $96.50 level. The main resistance could be $98. A successful close above the $98 resistance zone could set the pace for another steady increase. The next key resistance is $102. Any more gains might send the price toward the $105 level.
If SOL fails to rise above the $96.50 resistance, it could start another decline. Initial support on the downside is near the $94.00 zone. The first major support is near the $92.20 level, the trend line, and the 50% Fib retracement level of the recent upward move from the $87.61 swing low to the $96.85 high.
A break below the $92.20 level might send the price toward the $90 support zone. If there is a close below the $90 support, the price could decline toward the $88 support in the near term.
Technical Indicators
Hourly MACD – The MACD for SOL/USD is gaining pace in the bullish zone.
Hourly Hours RSI (Relative Strength Index) – The RSI for SOL/USD is above the 50 level.
Major Support Levels – $94.00 and $92.20
Major Resistance Levels – $96.50 and $98.00.


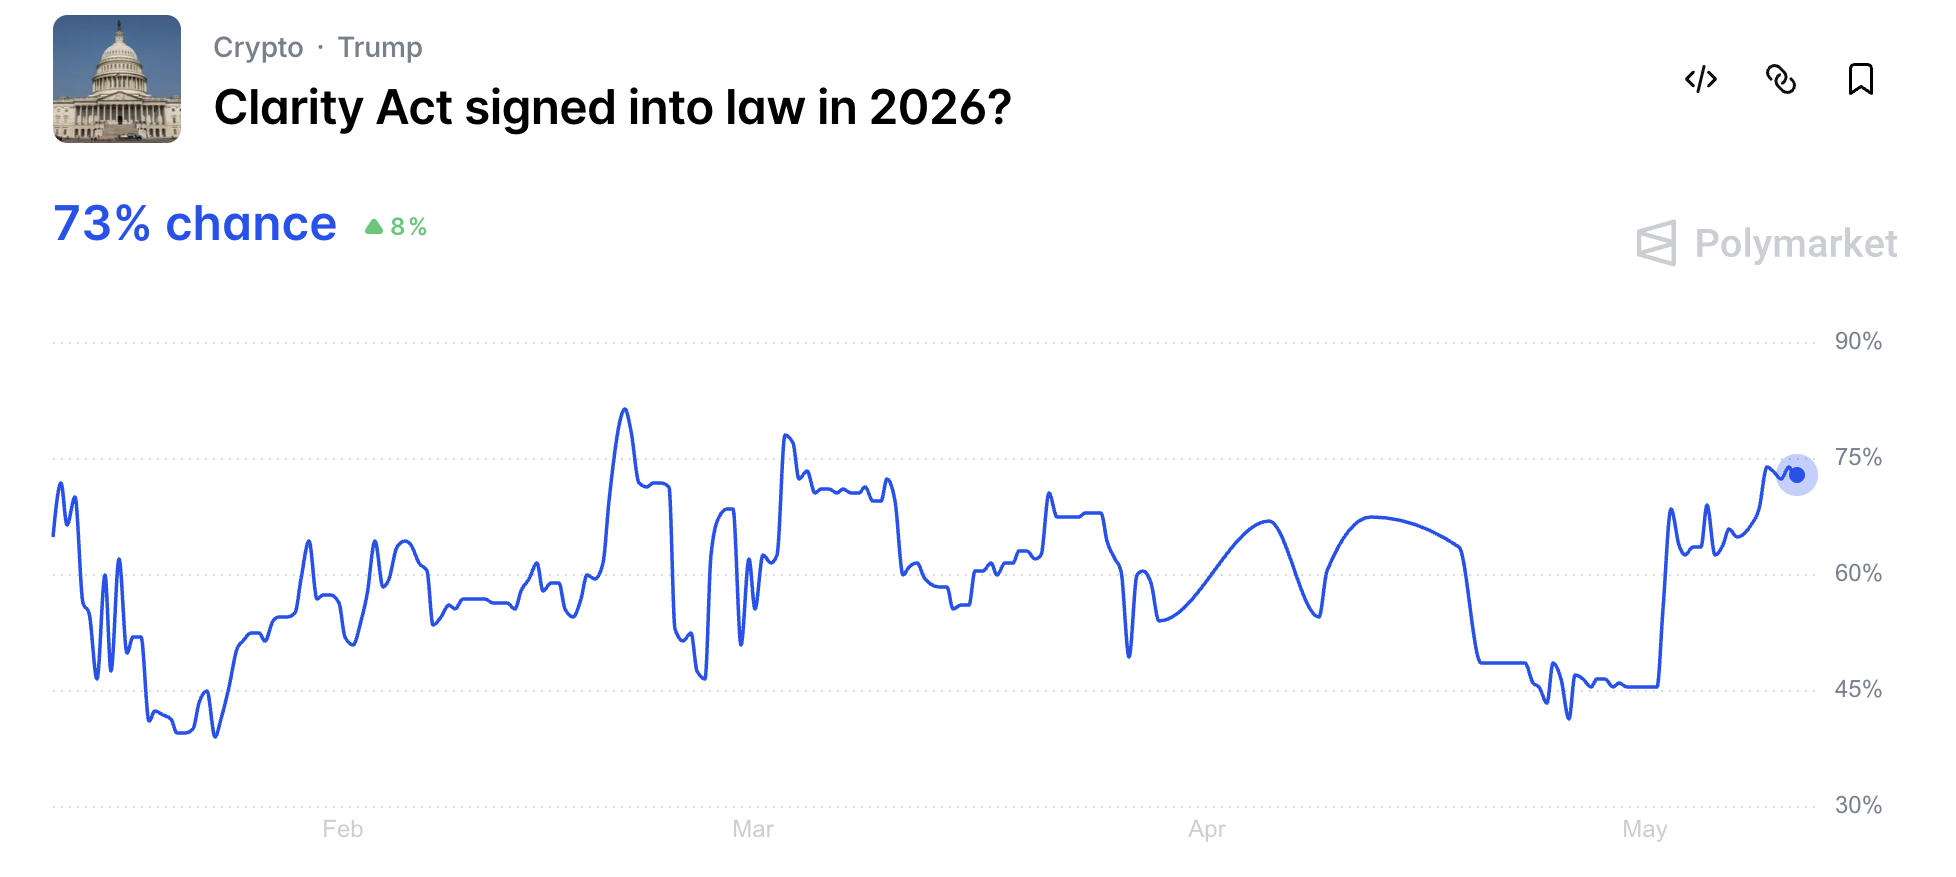
Polymarket traders now assign a 73% probability to the Digital Asset Market Clarity Act being signed into law in 2026. This marks a sharp rise

RBI’s intervention highlights the interconnectedness of global geopolitical tensions and economic stability, impacting markets and currencies worldwide. The post RBI intervenes to stabilize rupee amid
Michael Saylor defended Strategy’s Bitcoin-backed credit model after critics argued that the company’s STRC dividend structure resembled a Ponzi scheme, saying the business is built
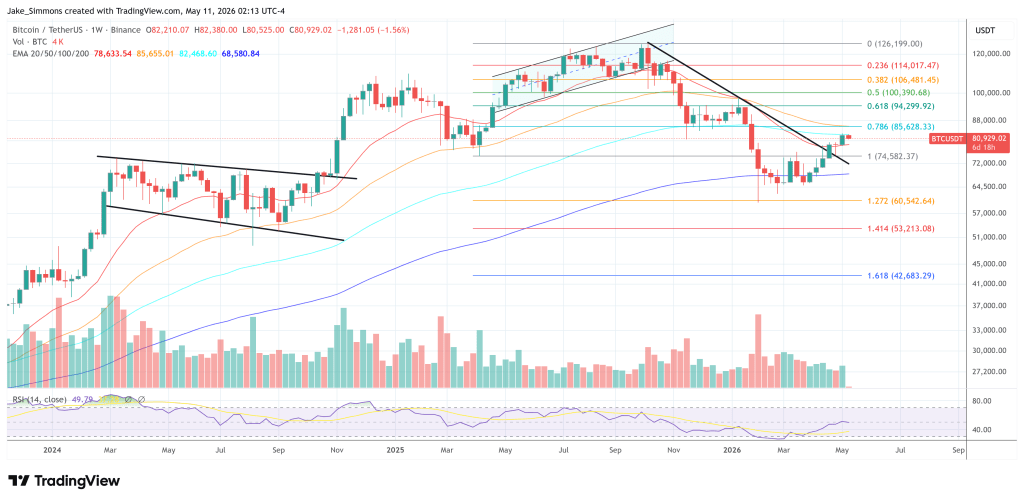
Crypto markets have gained marginally over the weekend, hitting a weekly high on Monday morning trading in Asia. But this week’s inflation reports could put