

Solana failed to settle above $92 and corrected most gains. SOL price is now consolidating losses above $84 and might attempt another increase.
Solana price failed to remain stable above $92 and started a fresh decline, like Bitcoin and Ethereum. SOL declined below the $90 and $88 levels.
The bears even pushed the price toward $83. A low was formed at $83.35, and the price is now consolidating losses. The price is still showing bearish signs below the 23.6% Fib retracement level of the downward move from the $93.63 swing high to the $83.35 low.
Solana is now trading near $85 and the 100-hourly simple moving average. Besides, there is a connecting bearish trend line forming with resistance at $85 on the hourly chart of the SOL/USD pair.
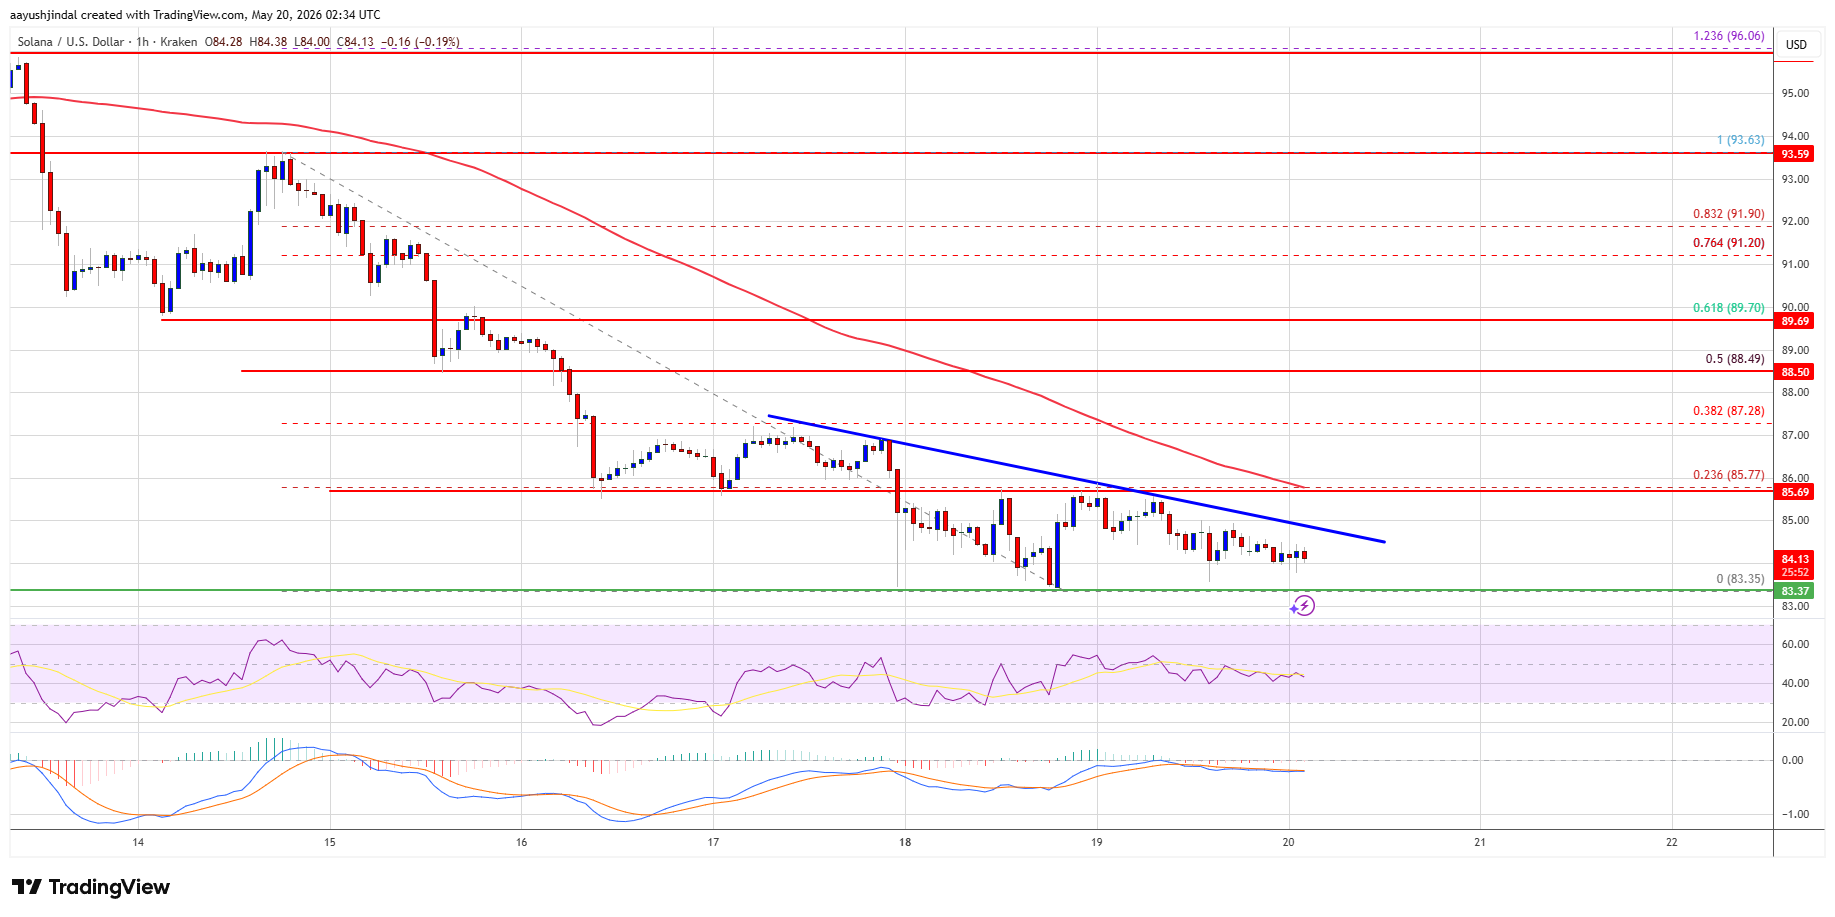
On the upside, immediate resistance is near the $85 level. The next major resistance is near the $85.80 level. The main resistance could be $88.50 or the 50% Fib retracement level of the downward move from the $93.63 swing high to the $83.35 low. A successful close above the $88.50 resistance zone could set the pace for another steady increase. The next key resistance is $90. Any more gains might send the price toward the $92 level.
If SOL fails to rise above the $88.80 resistance, it could continue to move down. Initial support on the downside is near the $83.50 zone. The first major support is near the $82 level.
A break below the $82 level might send the price toward the $80 support zone. If there is a close below the $80 support, the price could decline toward the $75 support in the near term.
Technical Indicators
Hourly MACD – The MACD for SOL/USD is gaining pace in the bearish zone.
Hourly Hours RSI (Relative Strength Index) – The RSI for SOL/USD is below the 50 level.
Major Support Levels – $83.50 and $82.00.
Major Resistance Levels – $85.80 and $88.50.


The postponement highlights the delicate balance of regional diplomacy and economic stability, with potential global repercussions if tensions escalate. The post Trump postpones planned Iran
Roughly $440.6 million in leveraged crypto positions were liquidated over the past 24 hours, underscoring how quickly risk is being flushed out even as headline
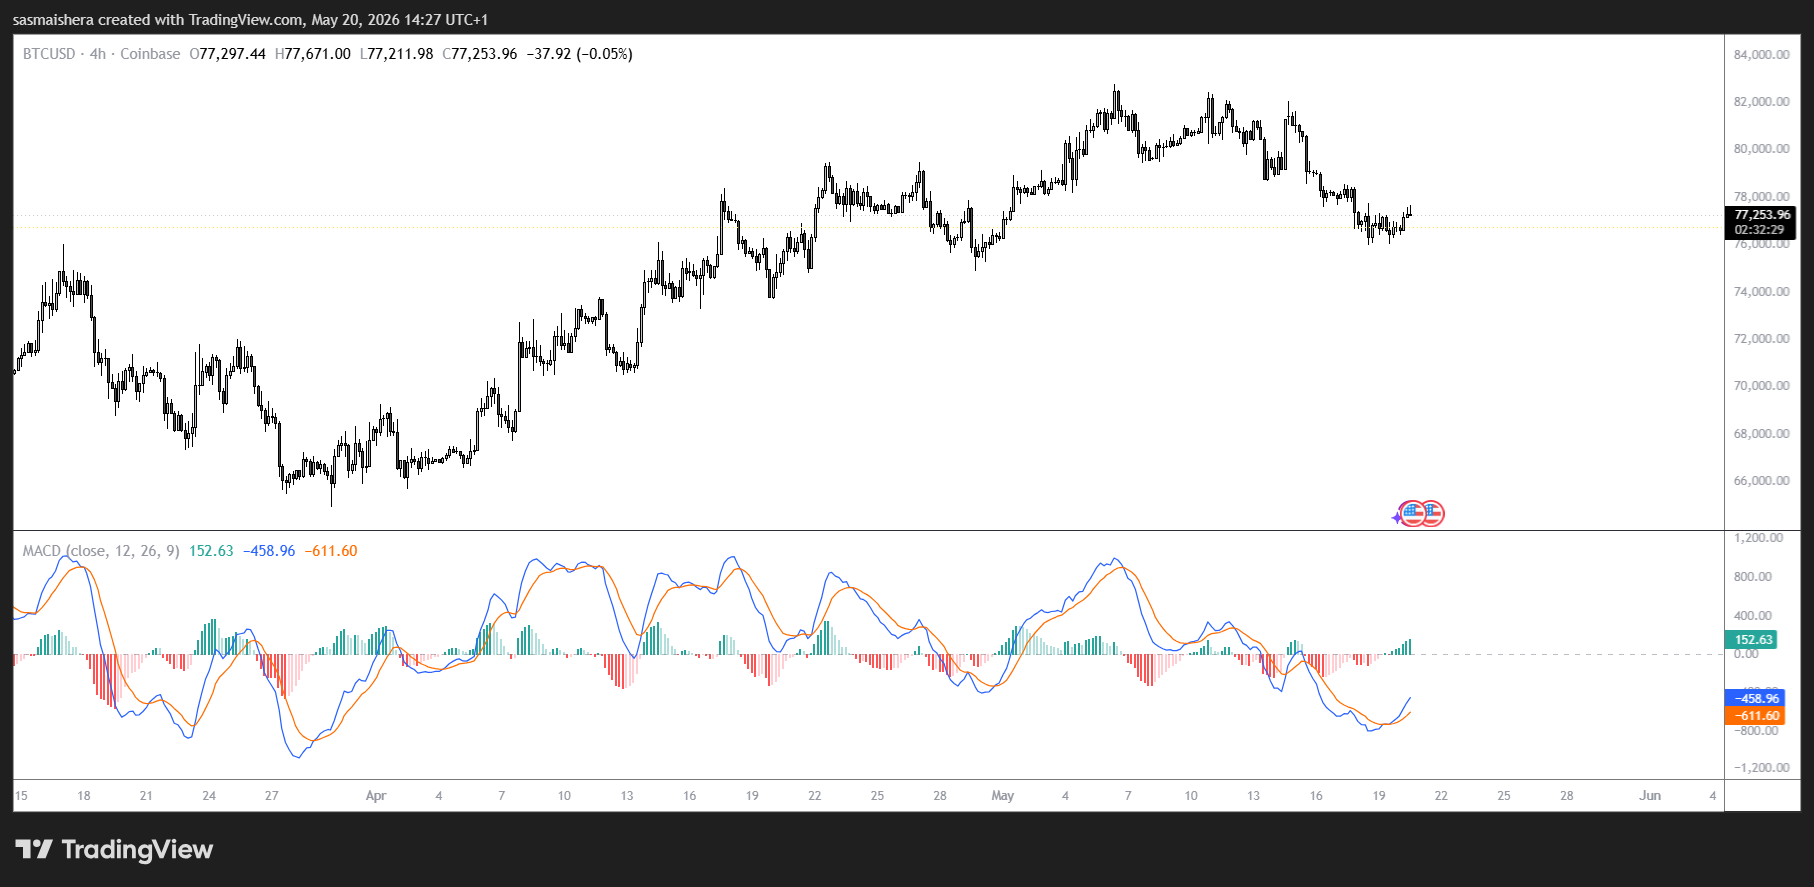
Key takeaways BTC remains around the $77k level after rejecting the 200-day moving average. The bearish performance comes as rising inflation and Treasury yields weigh
The US-Iran war continues to linger with the two countries yet to reach a deal, and US President Donald Trump is threatening new strikes against