Solana volatility hits a multi-year low, with the 30-day annualized reading dropping to 35.5%. In 2026, it even fell to under 26% for a brief period.
Per BeInCrypto’s exclusive Solana volatility dashboard, this compression marks one of the lowest sustained 30-day prints the indicator has tracked. The cause sits in a structural shift in who owns SOL. The spot ETF, launched in October 2025, has not had a single month of outflows.
Long-term holder supply has expanded sharply over the past two months. The result is a market that has neutralized a textbook breakdown pattern, but capped the upside in the process.
Per BeInCrypto’s Solana volatility dashboard, the 30-day annualized volatility, a measure of how much SOL’s daily returns deviate from their average over the previous month, sits at 35.5% as of May 4. The 90-day reading is 57.4%. The 200-day is 54.0%.
Want more token insights like this? Sign up for Editor Harsh Notariya’s Daily Crypto Newsletter here.
Compare those numbers to early 2024. The same metrics printed 109% on the 30-day, 92.6% on the 90-day, and 78.8% on the 200-day. Even the early 2026 lows of 58.5%, 50.1%, and 25.8% are now being matched by the active 30-day window.
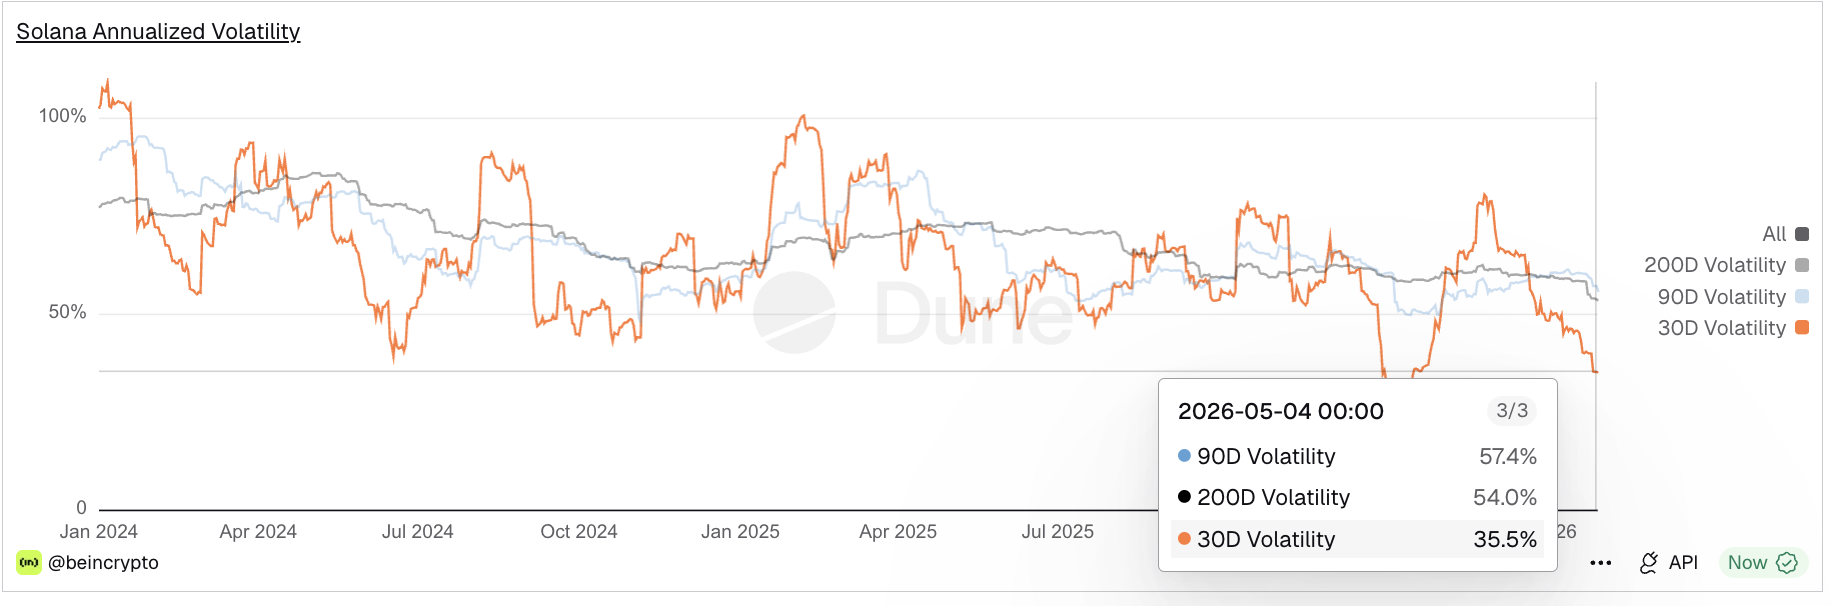
Two structural facts make the current reading notable. First, the 30-day has dropped below both the 90-day and the 200-day, a configuration that signals the recent trading regime is calmer than the medium-term average.
Second, the SOL price volatility compression has held through a period of macro turbulence, including the April FOMC meeting and the Project Freedom geopolitical risk premium that lifted broader risk assets. Volatility does not compress on its own. Something is absorbing the swings.
Two strands of ownership data explain the volatility drop.
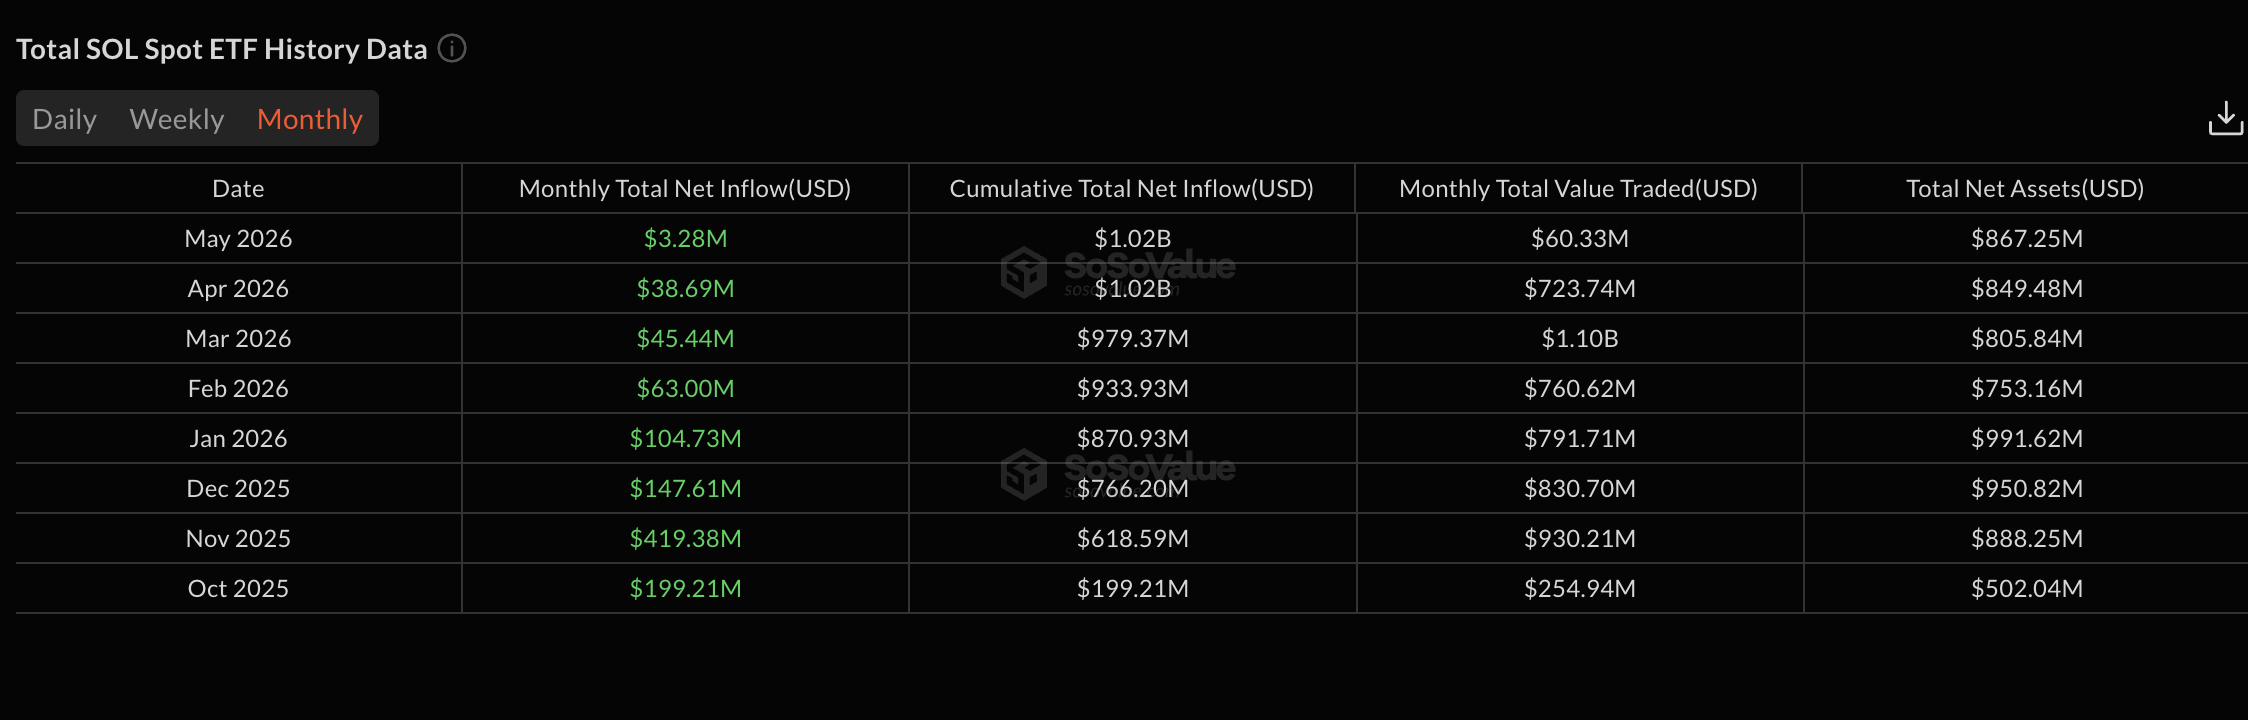
First, spot Solana ETF flows. The products launched in October 2025 and have not posted a single month of net outflows since. Per SoSoValue data, cumulative inflows have crossed $1.02 billion. Monthly flows have slowed from $419 million in November 2025 to $39.93 million in April 2026, but the cumulative absorption has kept growing every single month.
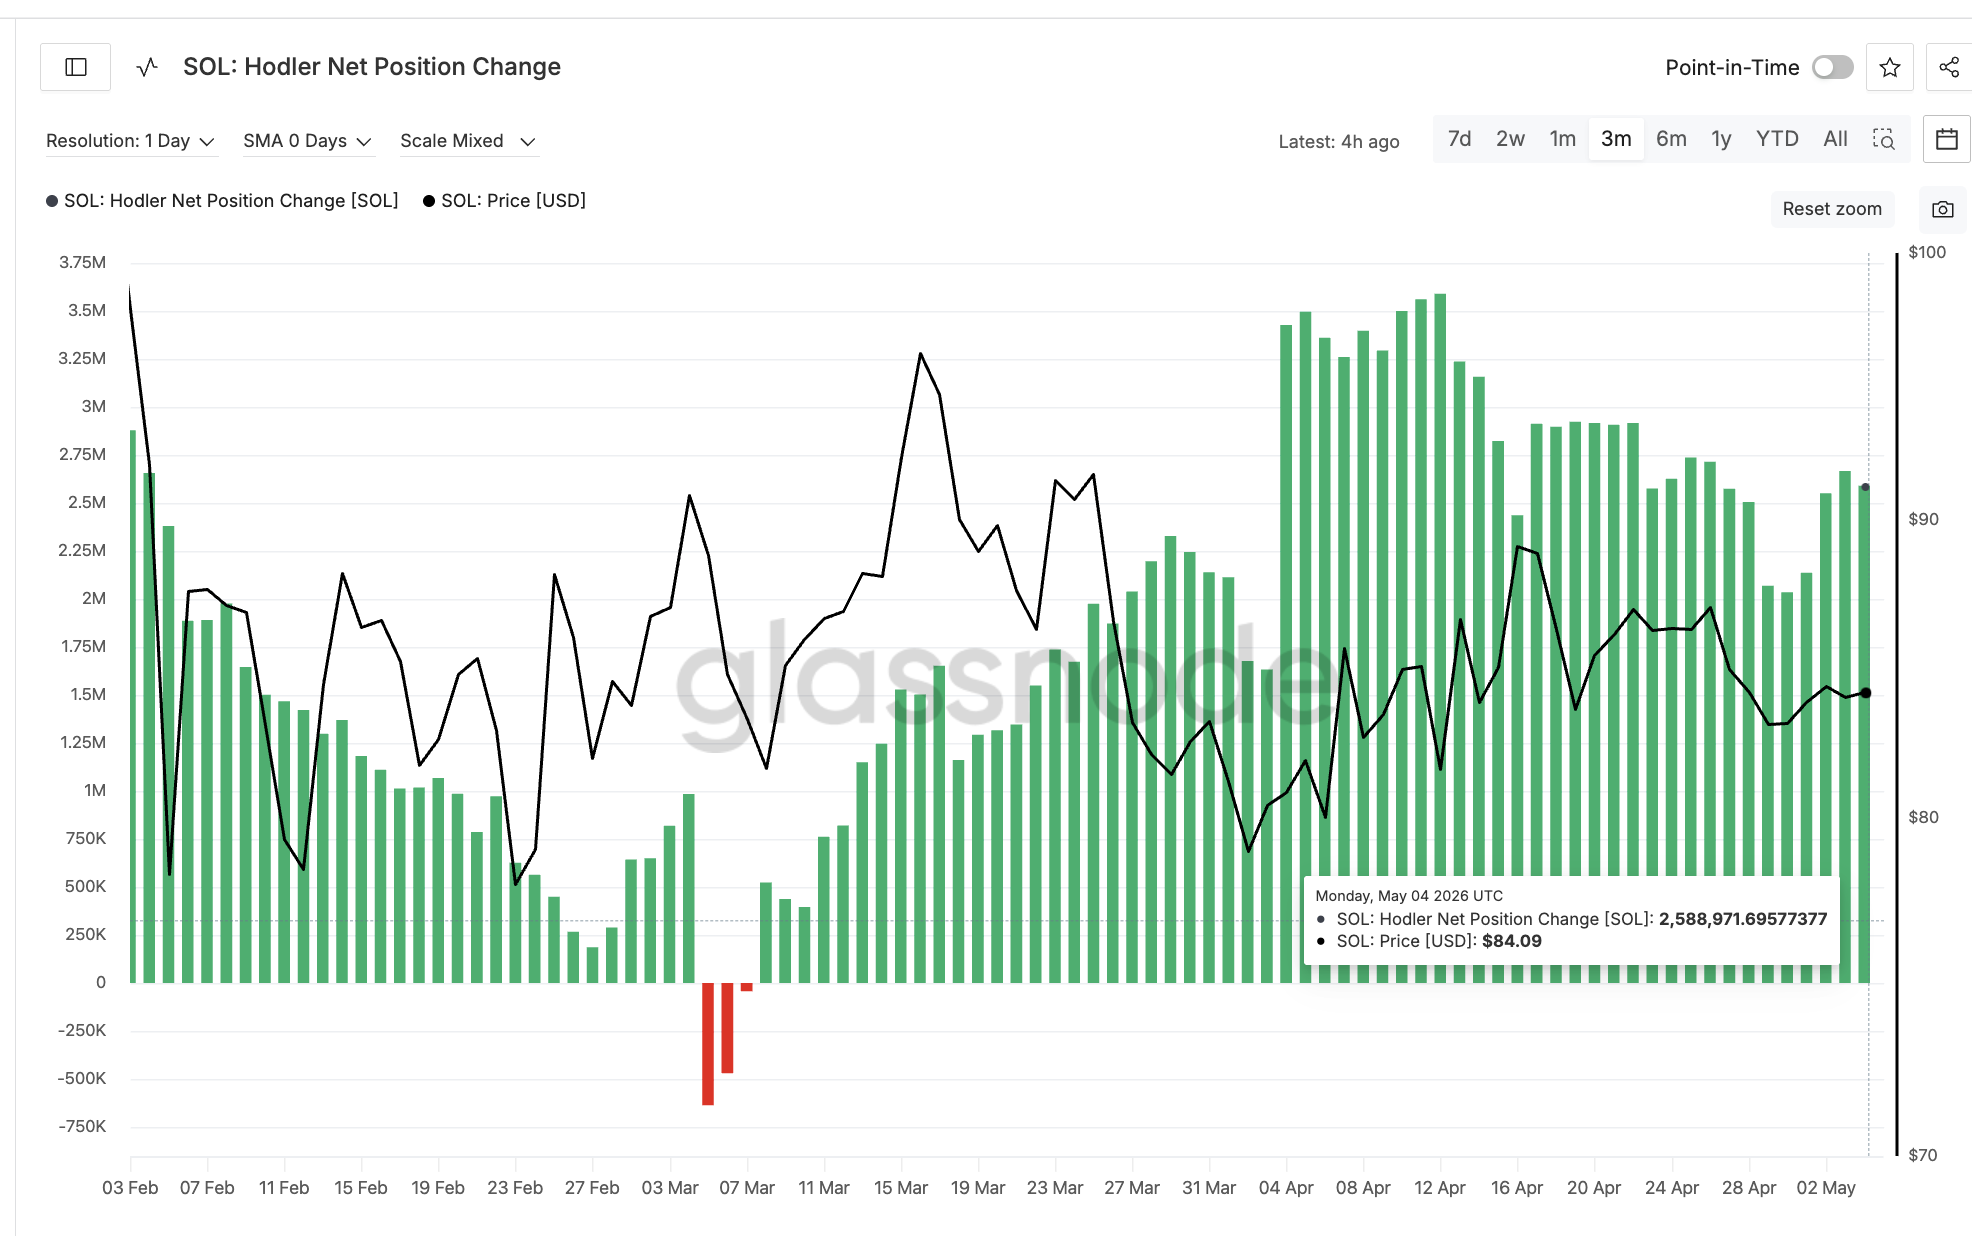
Second, long-term holder accumulation. Glassnode’s Hodler Net Position Change metric, which tracks accumulation by addresses holding SOL for at least 155 days, expanded from 524,366 SOL on March 8 to 2,588,971 SOL on May 4. That is roughly a five-fold increase in two months.
The combination matters. ETFs absorb supply that does not flow back into the market. Long-term holders accumulate during price weakness rather than during strength. When both forces operate during a flat tape, realized swings compress because the patient cohort is buying every dip and the speculative cohort that drove past volatility no longer dominates flow.
The Solana price chart confirms the same story from a different angle.
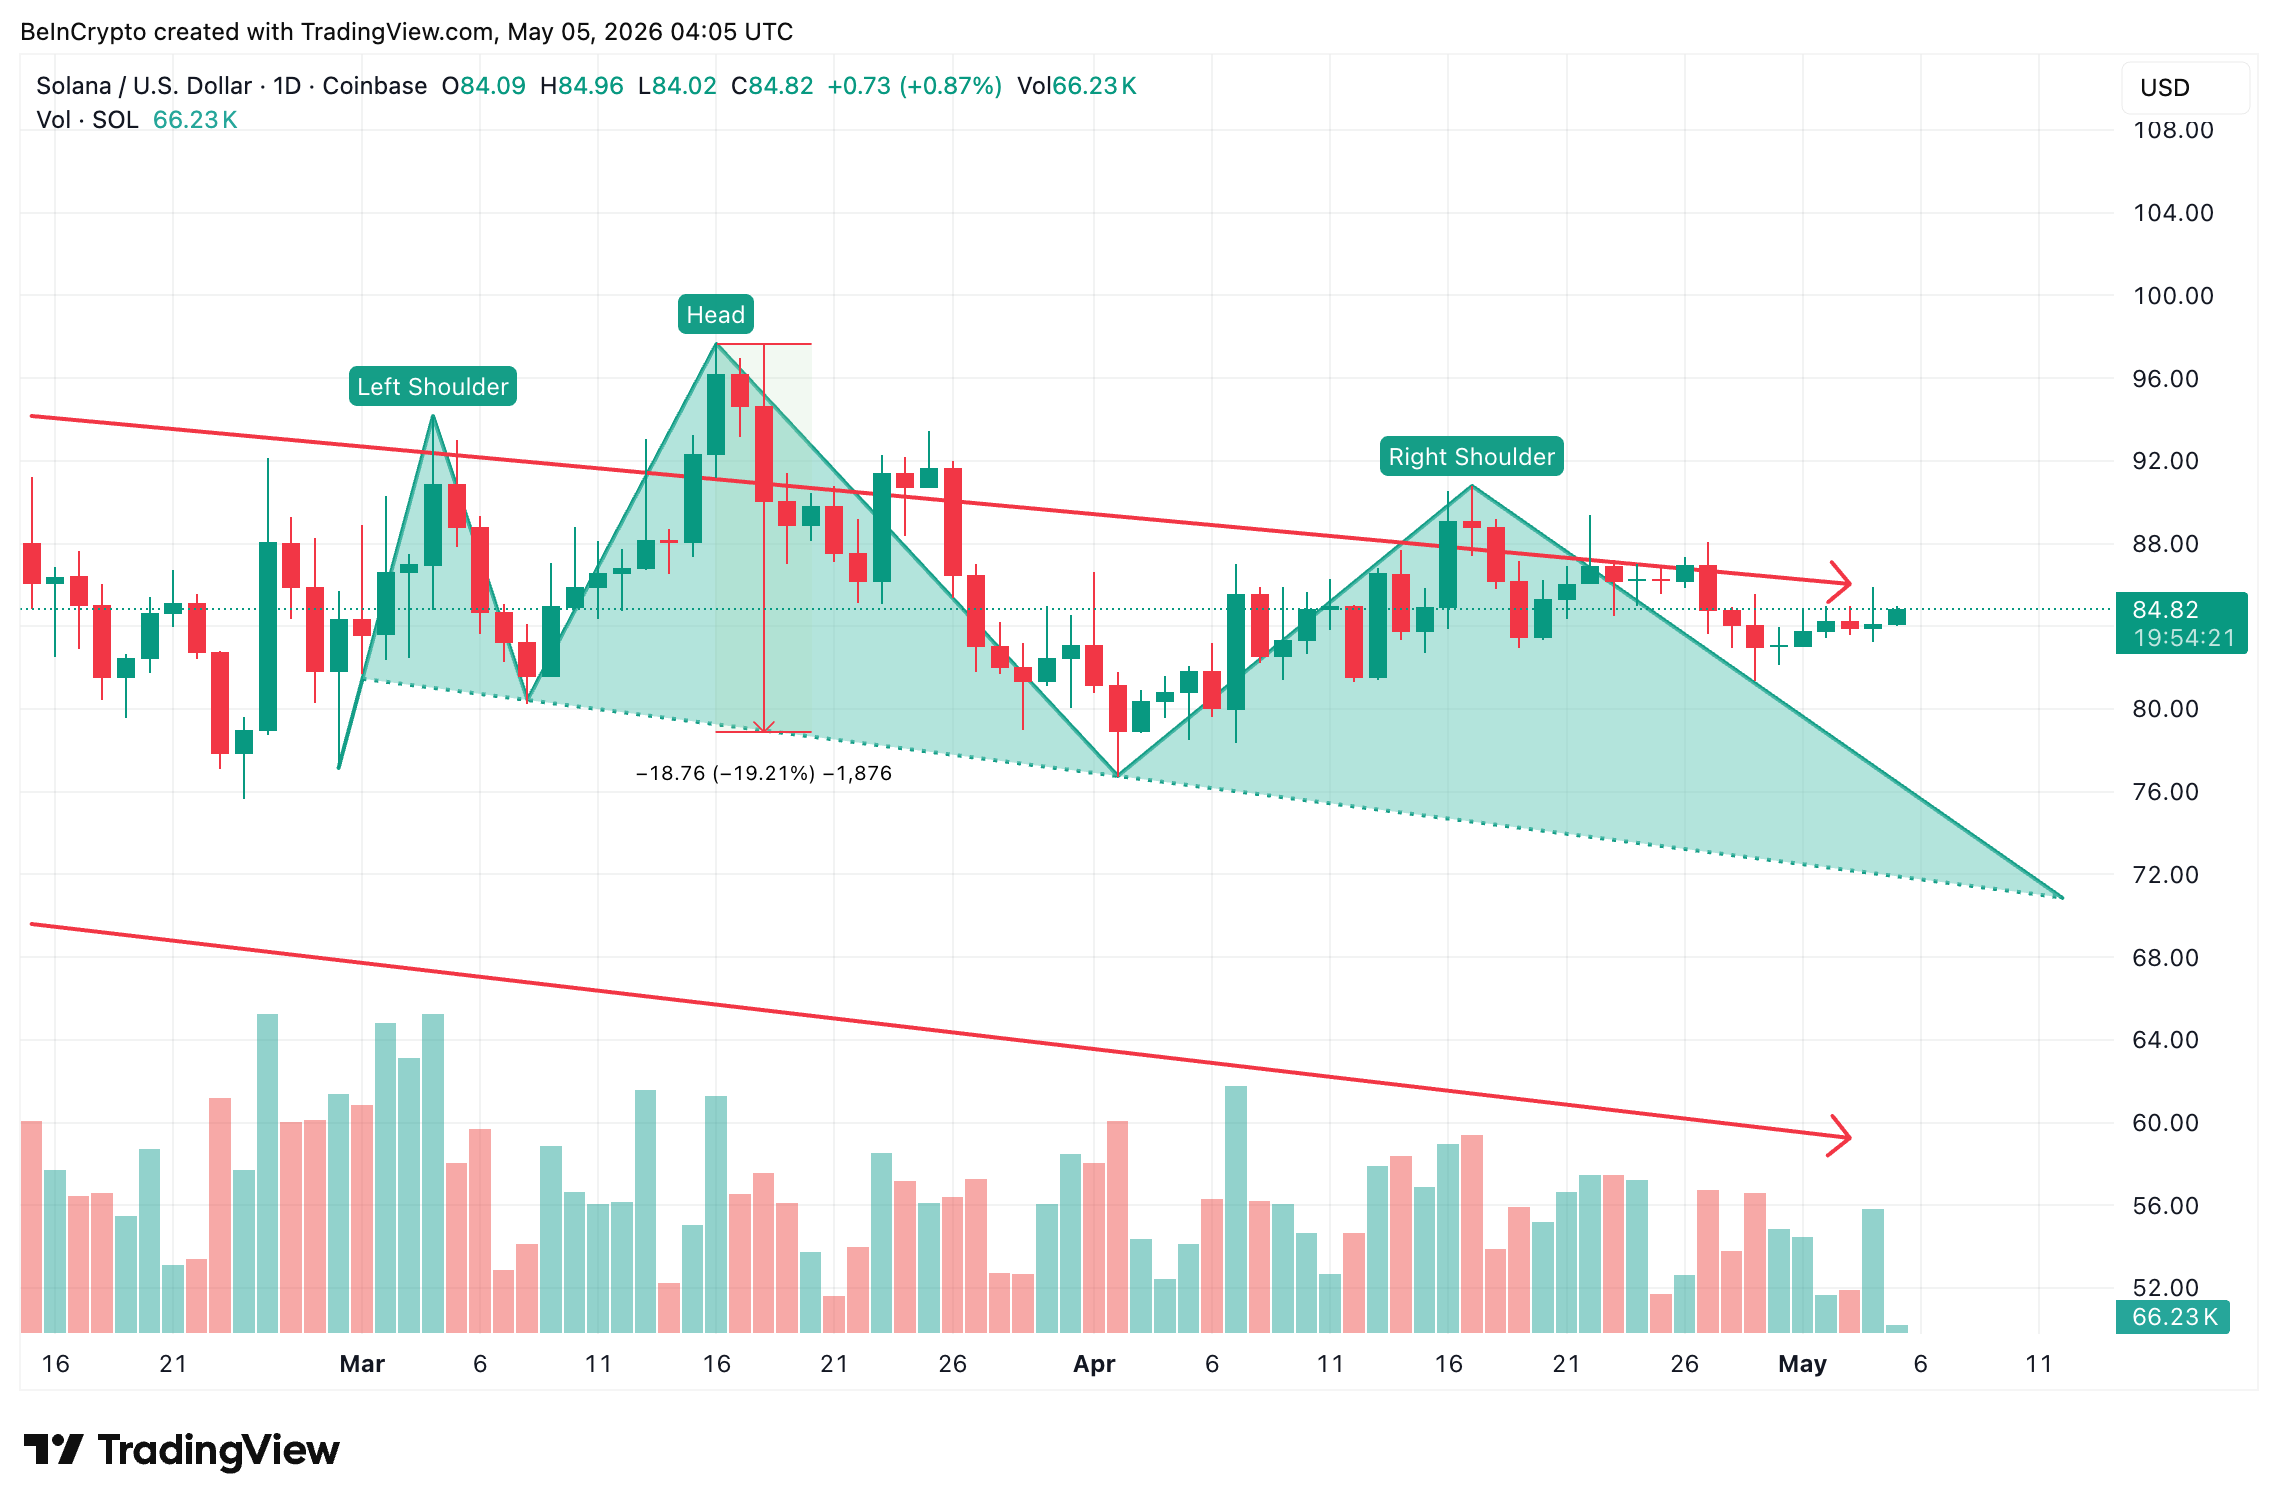
Solana has been trading inside a head and shoulders pattern, a bearish reversal setup.
The pattern projects a 19.21% breakdown. But the breakdown has not happened. Sell volume has declined sharply since the mid-February highs, signaling that the seller pressure required to pull SOL through the neckline is structurally absent.
That absence is the institutional bid showing up in price action. Long-term holder accumulation and ETF inflows have possibly absorbed the selling pattern needed to complete its measured move.
The same forces have also capped the upside. SOL has gained roughly 4% over the past 30 days. Bitcoin has gained closer to 20% in the same window. Institutional ownership has stabilized the asset but removed the high-velocity flow that drives speculative breakouts.
The level of math is tight in both directions. Holding $82.86, the 0.382 Fibonacci level, keeps the consolidation intact. A break of $82.86 exposes $77.91. A close below $69.89 confirms the breakdown the pattern projects, but would require a return to higher selling volume, which the current institutional flow data does not support. The full $56.92 target only activates if the institutional thesis breaks.
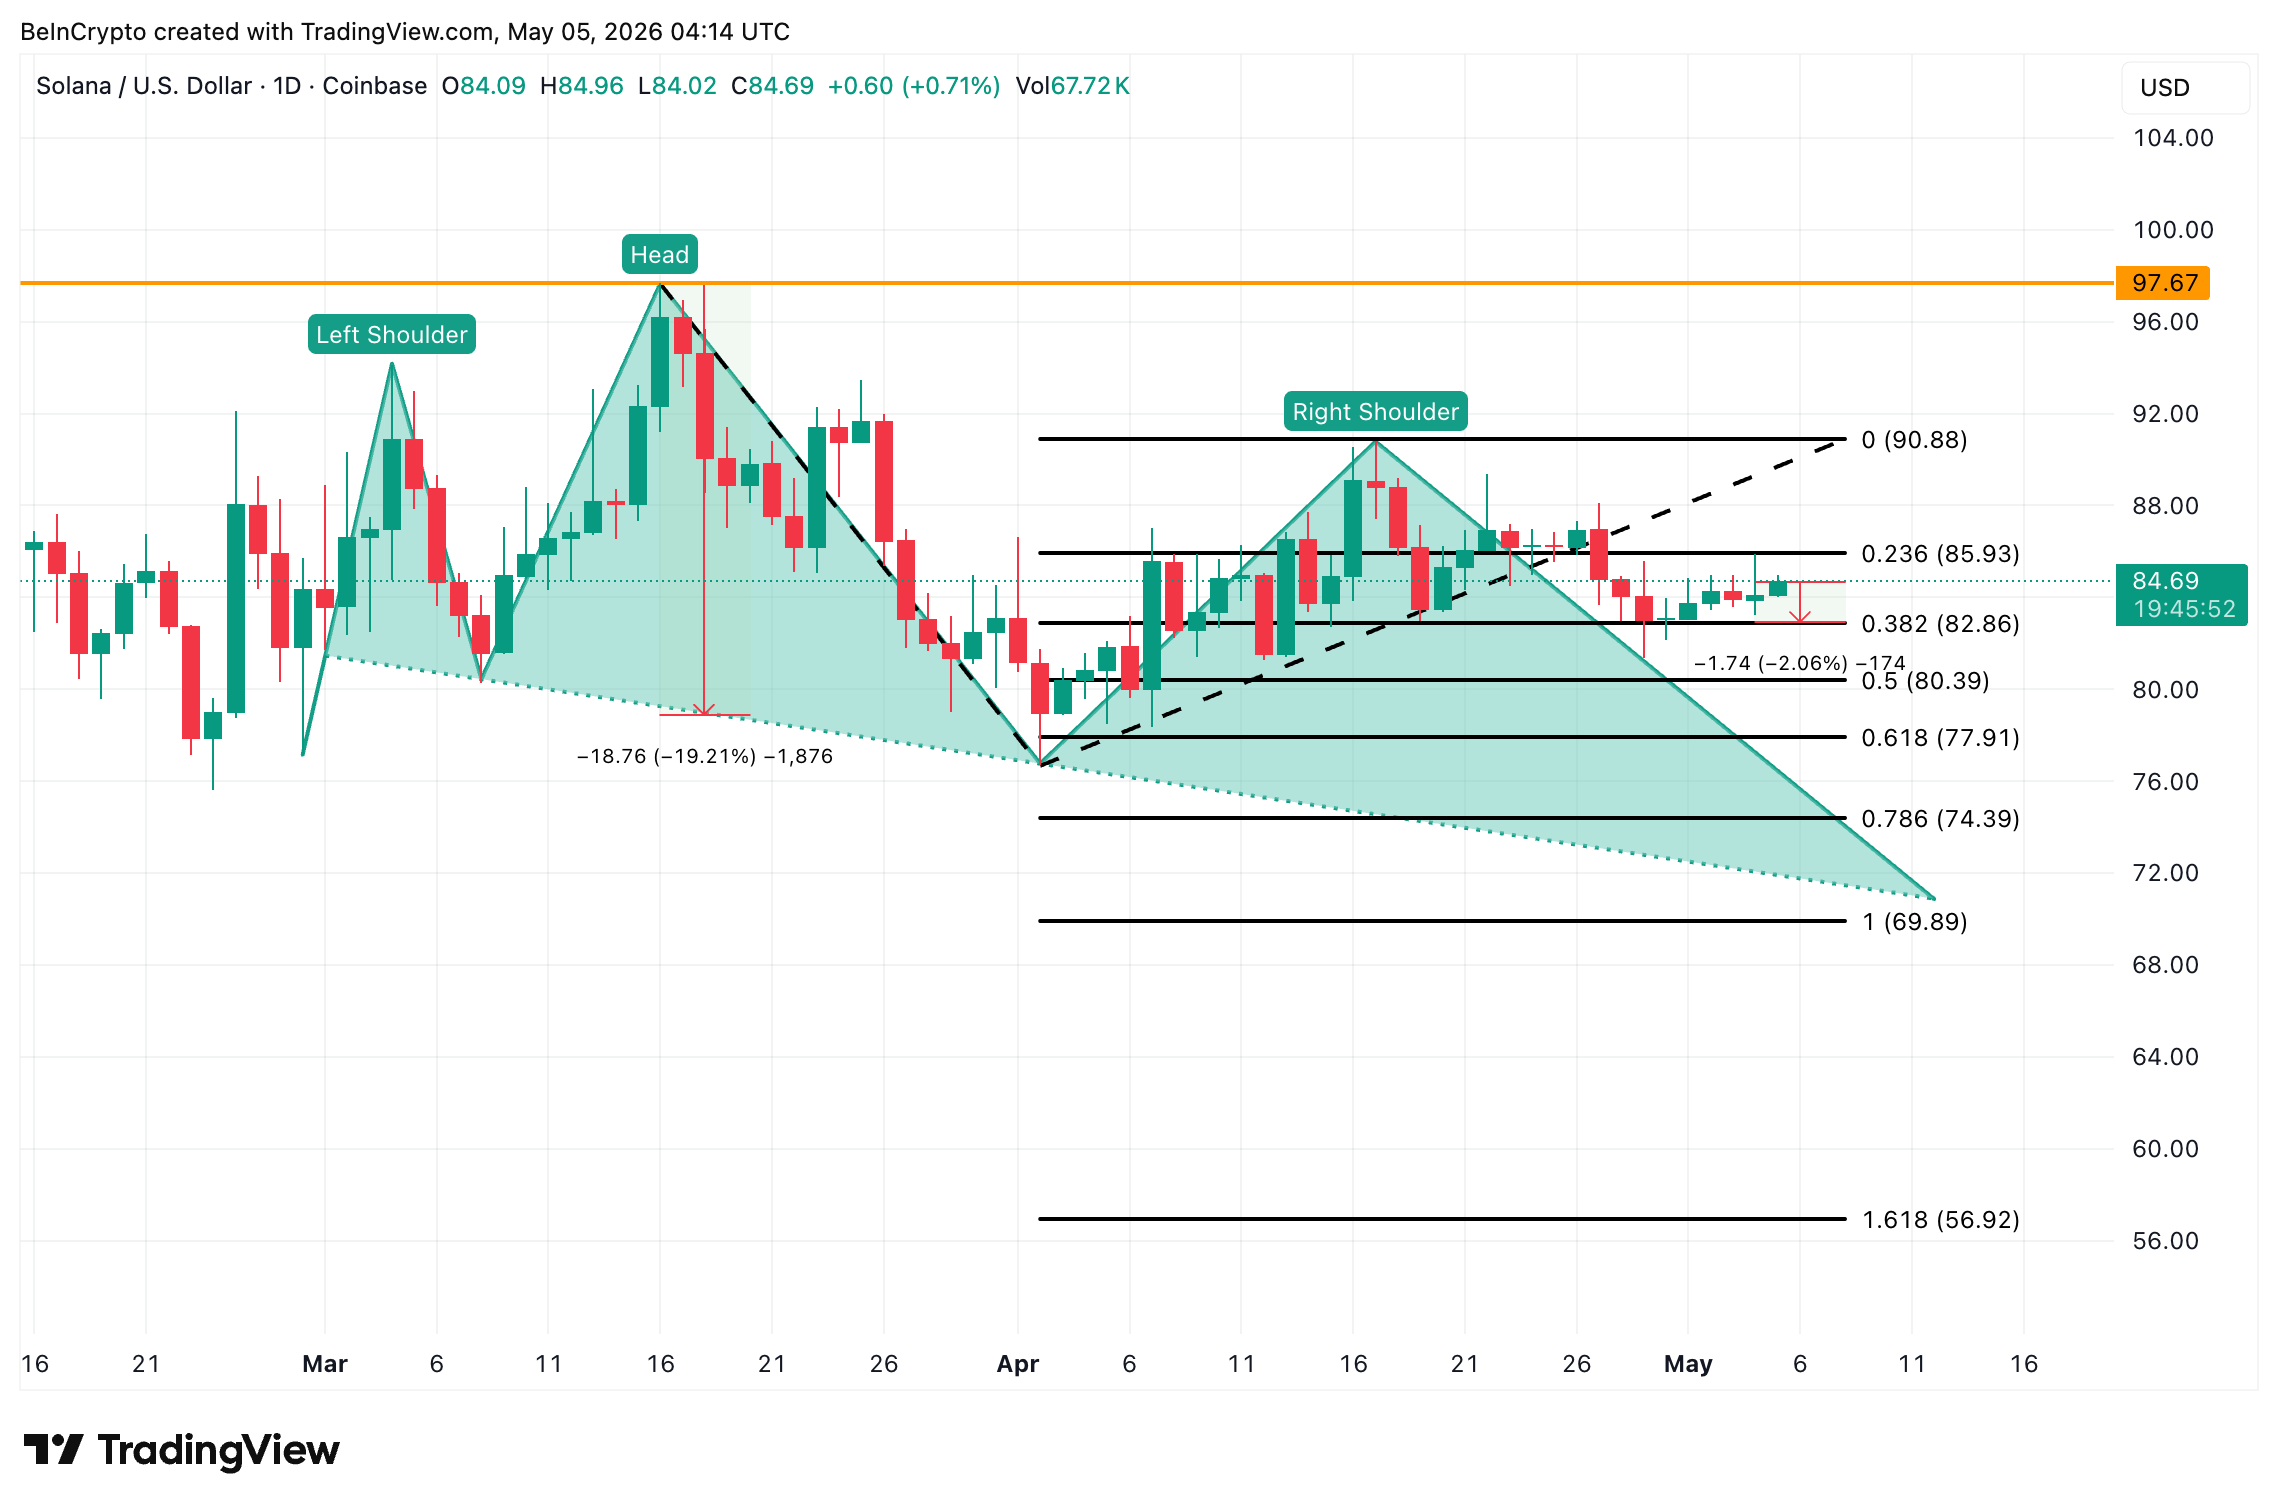
On the upside, a daily close above $85.93 reopens the path to $90.88. A break above $90.88 neutralizes the head and shoulders structure entirely. Above $97.67, the head’s high, the recovery becomes structural.
The $82.86 to $85.93 range is the line in the sand. A clean break above $85.93 hands the move back to the bulls. A daily close below $82.86 cracks the institutional floor and reopens $77.91. Until volatility expands in either direction, Solana stays caught between two forces that are neither selling nor buying with conviction.
The post Solana’s Volatility Hits a Multi-Year Low and The Institutional Trade Explains Why appeared first on BeInCrypto.


Dogecoin surged through $0.109 resistance on a 55.80% volume spike as Bitcoin cleared $80,000. Here’s the bull, base, and bear case for DOGE price this
Key Takeaways: Bitcoin has re-captured the first level in three months of at least $80,000 marking the renewed momentum. The support of the rally is
Persistent inflation may lead to prolonged higher interest rates, impacting borrowing costs and economic growth prospects in 2026. The post Fed rate cuts unlikely in
David Schwartz, formerly Ripple’s Chief Technology Officer and widely known online as JoelKatz, disclosed this week that he once held 26 million XRP, a sum