

WLD is trading around $0.40 after gaining more than 12% over the past week, while a bullish SuperTrend flip on both the daily and weekly charts has drawn attention to the possibility of a broader stabilization.
The recovery follows a steep multi-year decline from above $11. According to crypto trader @0xSupremo_, WLD has rebounded roughly 79% from its May 2026 low near $0.23. The trader’s analysis highlights higher lows on the daily chart and SuperTrend support near $0.33, although the weekly setup remains in an early stabilization phase rather than a confirmed long-term reversal.

WLD’s SuperTrend has flipped bullish on both the daily and weekly charts, signaling a potential shift from its prolonged multi-year downtrend toward a broader recovery. Source: @0xSupremo_ via X
The immediate technical challenge is concentrated around $0.42-$0.52. This area represents a significant resistance band that WLD would need to overcome before the recent recovery could develop into a more established uptrend.
Short-term momentum has improved considerably as WLD moved back above $0.40. A 30-minute trend-following scan shared by Olivier Langlois identified WLD at $0.4116, roughly 4.57% above its 24-hour volume-weighted average price (VWAP).
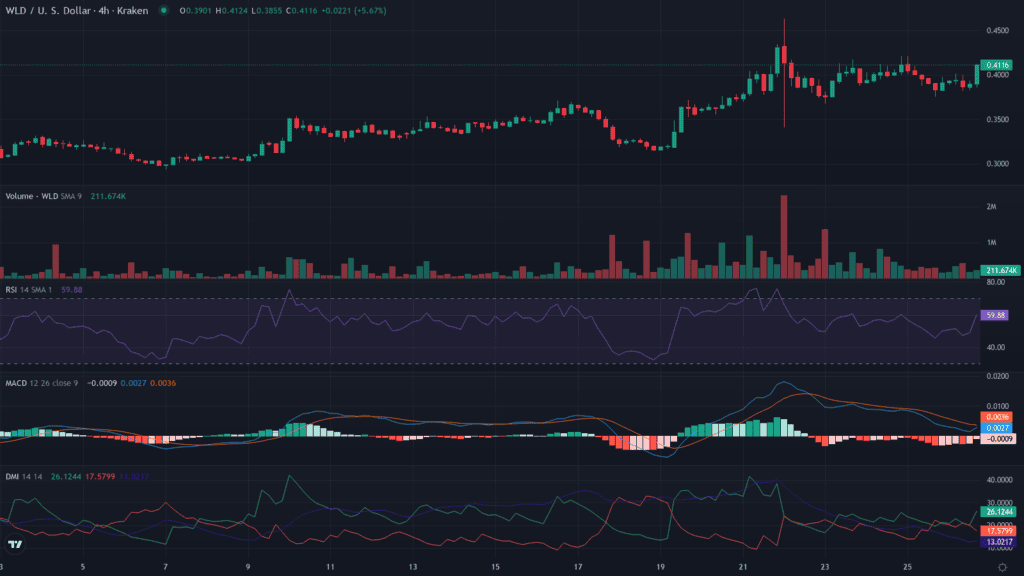
WLD shows strengthening bullish momentum across multiple timeframes, with rising RSI, positive MACD crossovers, and improving DMI readings supporting the trend. Source: Olivier Langlois via X
The same scan recorded an RSI of 82 and an ADX reading of 32, accompanied by solid trading volume on Kraken. The readings point to strong near-term momentum, although the RSI level also indicates that the market was entering overbought territory on the 30-minute timeframe.
The trader described the setup as “TRENDY HEAT” while highlighting bullish price action across the 15-minute, 30-minute, one-hour, and four-hour charts. Positive MACD crossovers and improving directional movement readings added to the short-term momentum signal.
That strength does not necessarily mean WLD must continue rising without interruption. A high intraday RSI can also leave the market vulnerable to a consolidation or pullback before another attempt at resistance.
The SuperTrend indicator is providing one of the more notable technical developments for WLD. @0xSupremo_ identified bullish flips on both the daily and weekly charts, following an extended period in which the token remained under significant selling pressure.
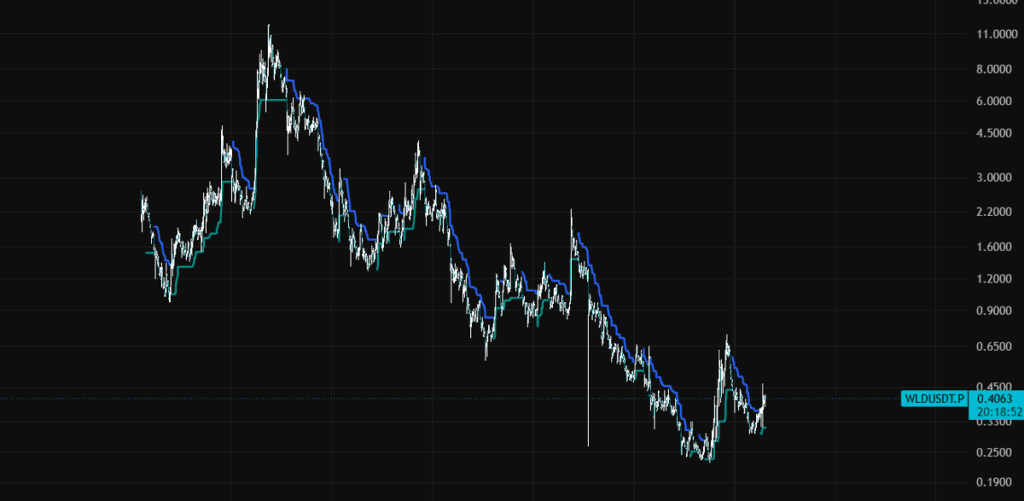
The bullish SuperTrend flip signals early stabilization, but WLD remains within a broader downtrend and needs sustained higher highs to confirm a meaningful trend reversal. Source: @0xSupremo_ via X
On the daily chart, the formation of higher lows and SuperTrend support near $0.33 suggest that buyers have gained greater control of the recent price structure. However, the weekly signal is better viewed as an early improvement than definitive evidence of a long-term trend reversal.
A sustained series of higher highs would provide stronger confirmation. Until that occurs, the current move can still be classified as a recovery within a much larger historical downtrend.
The analyst also pointed to recent developments involving a Grayscale ETF filing and reduced token unlocks as factors that could improve the market backdrop for WLD. These developments may influence investor sentiment, but price confirmation remains important when assessing whether the technical recovery can persist.
WLD’s position relative to its major moving averages is another important part of the current Worldcoin price prediction setup.
Recent technical analysis placed the 20-day, 50-day, and 200-day moving averages in a relatively narrow range around $0.36-$0.37. With WLD trading near $0.40, the token is currently above this cluster.
That positioning is constructive because the three averages provide a broader reference for short-, medium-, and long-term price trends. Maintaining the area as support would strengthen the recovery structure, while a sustained move below it would weaken the current bullish case.
The first nearby support levels are around $0.39 and $0.38. A decline through those levels would bring $0.36-$0.37 into focus. This moving-average zone is arguably more important than the immediate supports because it represents a convergence of several technical trend measures.
The Relative Strength Index (RSI) also favors buyers, although its interpretation depends heavily on the timeframe.
Recent daily readings have been around 60-63. Bitget’s technical data showed RSI(14) at 62.94, while another recent analysis placed the indicator at 60.4. Both readings are above the neutral 50 threshold but below the conventional 70 level associated with overbought conditions.
This gives WLD some room for additional upside momentum without the daily RSI itself signaling an extreme extension.
The picture is different on shorter timeframes. @cryptolevier’s 30-minute scan showed RSI at 82, indicating considerably stronger short-term momentum and a market that was already overbought on that timeframe.
The contrast between the daily and intraday RSI readings is important. It suggests that the broader recovery has strengthened without the daily market yet reaching the same level of technical extension seen on the shorter chart.
The Moving Average Convergence Divergence (MACD) indicator is another supportive component of the current setup.
Recent technical readings show the MACD line above its signal line alongside a positive histogram. One reading placed the MACD line at 0.012281, the signal line at 0.002637 and the histogram at 0.009644. Bitget’s more recent data showed MACD(12,26) at 0.01528 with a Buy signal.
The positive separation between the MACD and signal lines indicates that upward momentum has increased. This provides additional confirmation for the price recovery rather than relying solely on WLD’s move above $0.40.
However, MACD remains a lagging momentum indicator. It can confirm an established move, but it cannot by itself establish whether a long-term trend has definitively reversed.
The $0.40-$0.41 area is now the first major test for WLD. The token has been trading around this region, making a sustained close above the zone more significant than a temporary intraday breakout.
A decisive move above $0.41 could shift attention toward $0.42. The latter level is particularly important because it aligns with the 0.382 Fibonacci retracement of the approximately $0.23-$0.72 swing.
Breaking and holding above $0.42 would therefore provide a clearer technical signal that the recovery is extending beyond its initial phase.
Above $0.42, the next levels identified by recent technical analysis are $0.44 and $0.46. A move through $0.46 would represent another structural improvement and could put the $0.47 Fibonacci level into focus.
The $0.47 area carries additional significance because it corresponds closely with the 0.500 Fibonacci retracement of the recent $0.23-$0.72 swing.
WLD currently sits between the 0.236 retracement near $0.34 and the 0.382 level around $0.42. A move above $0.42 would therefore take the token through the first major Fibonacci resistance in the recovery structure.
Reaching $0.47 would require WLD to clear several intermediate barriers, including $0.44 and $0.46. For that reason, the level should be viewed as a medium-term technical reference rather than an immediate price objective.
The broader resistance area highlighted by @0xSupremo_ extends toward $0.52. A move into that region would require considerably stronger follow-through than the current rebound has demonstrated so far.
The downside structure remains equally important for assessing the Worldcoin price prediction.
Crypto trader Karim Beker recently identified $0.3590 as a key level on the four-hour Binance chart. A long lower wick around that area was interpreted as evidence of buying interest after sellers pushed price lower.
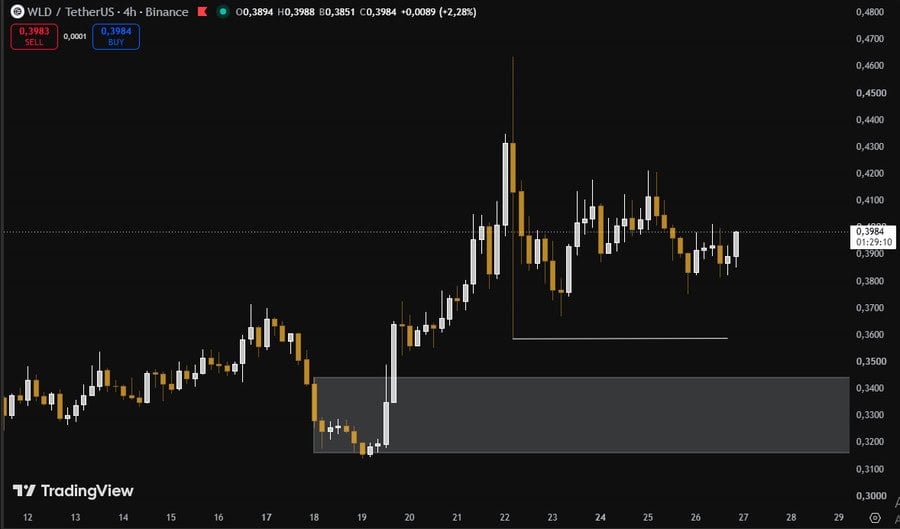
$WLD is consolidating near $0.3988, with $0.3590 showing buyer defense and $0.3400 serving as key historical support. Source: Karim Beker via X
The trader also highlighted $0.3400 as historical support that has remained relevant since the recent uptrend began. The chart shows WLD advancing from below $0.33 before entering a period of consolidation around $0.40.
These levels provide useful reference points if the current rally loses momentum. Holding $0.35-$0.36 would preserve much of the recent recovery structure, while a sustained breakdown below $0.34 would materially weaken it.
Bollinger Bands reinforce the view that WLD has entered a higher-momentum phase.
Recent readings place the upper band around $0.41, the middle band near $0.35, and the lower band around $0.28. With WLD trading close to $0.40, price is positioned near the upper portion of the volatility range.
Trading near the upper band is consistent with strong buying pressure, but it can also precede consolidation when price moves too far above its recent average. A sustained expansion above the upper band would indicate continued volatility expansion, while rejection around $0.41 could send WLD back toward lower support levels.
Despite the improvement in short-term technical conditions, TradingView’s broader ratings remain more cautious.
TradingView’s selected timeframe currently gives WLD/USD a Buy rating. However, its one-week and one-month technical ratings remain Neutral. The difference highlights the distinction between improving short-term momentum and a confirmed long-term trend reversal.
That distinction is particularly relevant after a multi-year decline. A bullish signal on a shorter timeframe does not automatically invalidate the larger bearish structure.
For WLD to establish a more convincing long-term reversal, price would need to sustain higher highs and higher lows while remaining above major moving-average support and clearing successive resistance levels.
The current technical structure gives traders several clearly defined levels to monitor.
On the upside, $0.41-$0.42 is the first major breakout area. A sustained move above it could bring $0.44, $0.46, and $0.47 into focus. The broader resistance zone identified by recent analysis extends toward $0.52.
On the downside, $0.39-$0.38 represents immediate support. Below that, the $0.36-$0.37 moving-average cluster is the key technical area. The $0.35 trendline region and $0.34 historical support provide additional downside references.
As of August 27, WLD’s technical picture is therefore improving, but the evidence remains stronger for a short-term bullish recovery than for a fully established long-term reversal. The positive MACD, RSI above 50, rising trend strength, and price above the major moving-average cluster all favor buyers. At the same time, neutral weekly and monthly TradingView ratings show that confirmation is still lacking on broader timeframes.
A sustained break above $0.41-$0.42 would strengthen the recovery case and place $0.44-$0.47 on the technical map, while a move toward $0.52 would require further resistance to be cleared. Conversely, losing $0.36-$0.37 would weaken the structure and put $0.35 and $0.34 back into focus.
Technical indicators should be treated as market-analysis tools rather than standalone forecasts. TradingView also notes that its technical ratings are not intended to serve as the sole basis for investment decisions and should be considered alongside price action, market conditions, and other relevant information.






StarkWare tests a quantum-resistant Bitcoin transaction on mainnet, showing a costly workaround that avoids changes to Bitcoin’s consensus rules. The post StarkWare Quantum Bitcoin Transaction:
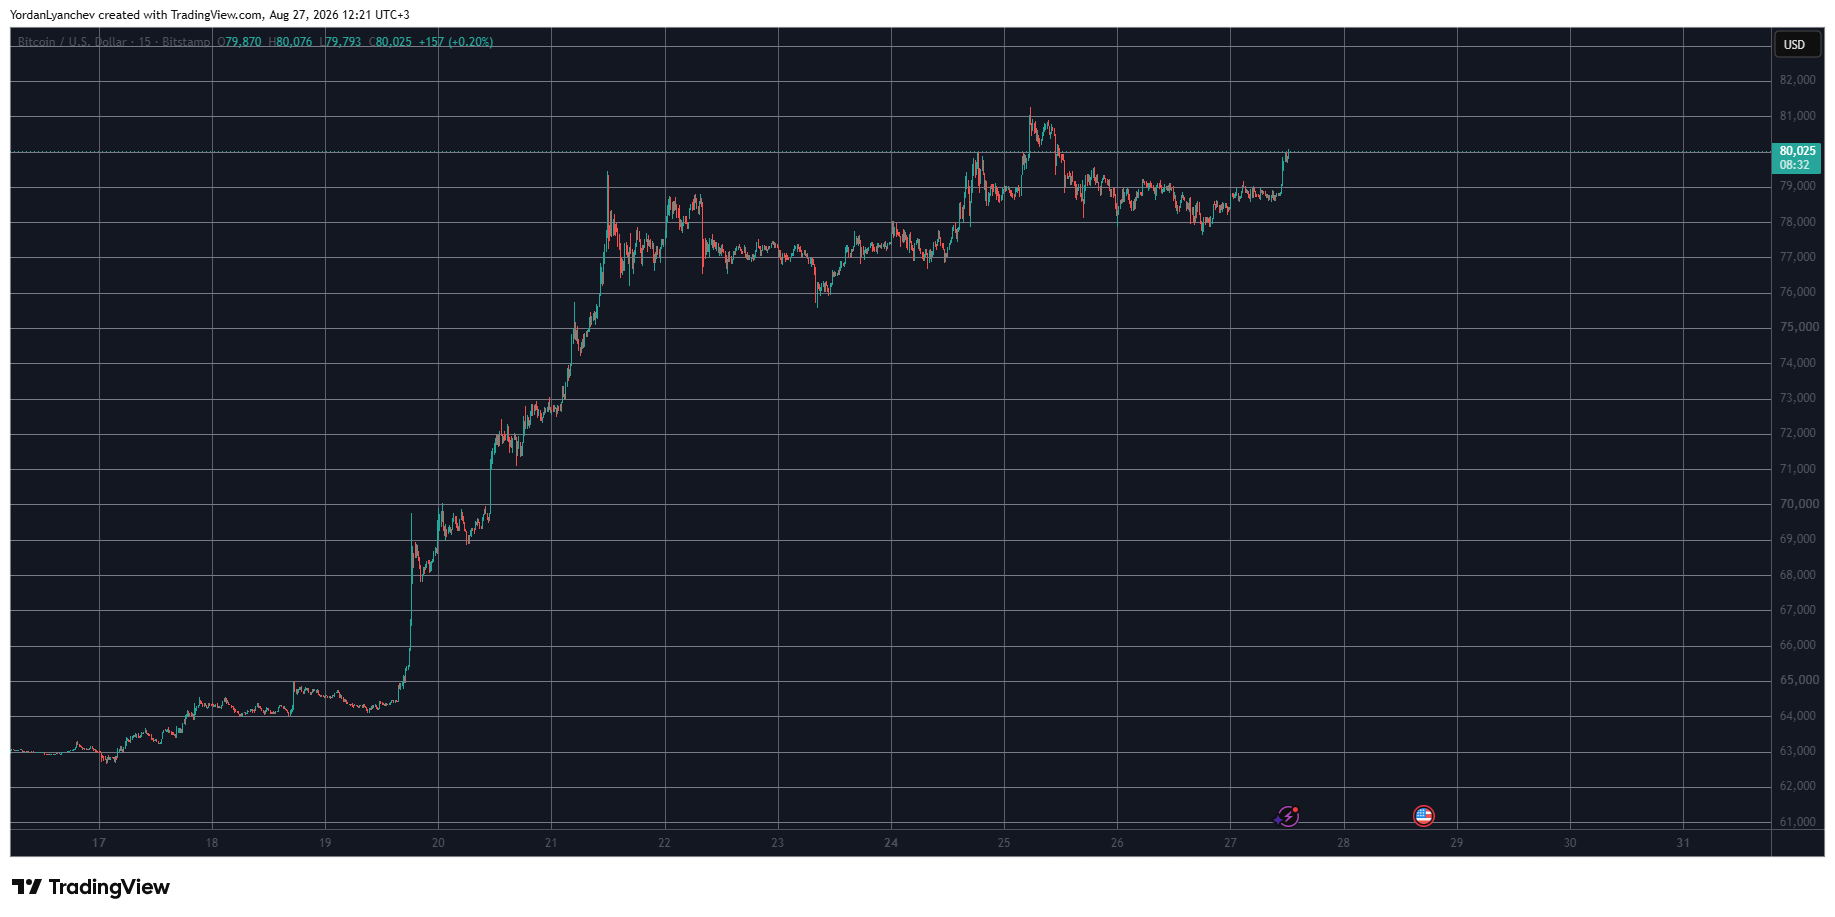
Bitcoin is on the move again in the right direction, jumping by over $2,000 since yesterday’s low and inching closer to the $80,000 resistance. Solana

XRP trades near $1.40 today, down roughly -2.5% on the day, a sizeable pullback bounce that sits inside a larger tug-of-war between bulls and a

South Korean cryptocurrency exchange Bithumb has reportedly won first-instance rulings in two lawsuits against its users to recover proceeds from Bitcoin it mistakenly credited to their accounts.The Seoul Central District Court ruled for Bithumb on Wednesday and Thursday in two of four lawsuits against users who sold Bitcoin mistakenly credited to their accounts, according to a Chosun Biz report.Thursday’s ruling concerned a claim for 194 million won ($140,000), while Wednesday’s covered a claim for 5 million won ($3,600). Two other lawsuits seeking about 14.8 million won ($10,700) and 500 million won ($362,000) remain pending.Both cases proceeded through service by public notice because court documents could not be delivered to the defendants through ordinary methods, the report said.The reported rulings advance Bithumb’s efforts to recover funds from its February error, when the exchange mistakenly credited 620,000 BTC, worth more than $40 billion at the time.Bithumb goes after Bitcoin sale proceedsBithumb said the error occurred during a promotional event on Feb. 6, 2026, when it planned to distribute 620,000 won, or about $420 at the time, in rewards to 249 users. An employee mistakenly selected Bitcoin instead of Korean won as the payment unit and credited customer accounts with 620,000 BTC.The exchange subsequently said it recovered 618,212 BTC, or 99.7% of the mistakenly credited amount. However, some users had already sold 1,788 BTC worth of the credited balances before Bithumb froze the affected accounts.Related: Bithumb sets 2028 IPO timetable as it overhauls internal controlsBithumb filed four unjust enrichment lawsuits in March against users who sold the mistakenly credited Bitcoin and did not return the proceeds. The company was reportedly seeking cash from those sales rather than Bitcoin.FSS begins sanctions process over Bithumb errorSouth Korea’s Financial Supervisory Service (FSS) investigated Bithumb over the Feb. 6 Bitcoin error, focusing on how the exchange could credit customers with Bitcoin it did not hold. The regulator reportedly sent Bithumb an inspection opinion in early August, formally beginning sanctions proceedings, but no final penalty has been announced.Cointelegraph approached South Korea’s Financial Services Commission (FSC), which oversees the FSS, for an update on the investigation and potential sanctions against Bithumb but did not receive a response by the time of publication.Bithumb has faced other legal scrutiny this year. South Korean police raided its offices in June as part of an unrelated investigation into alleged hiring favoritism involving lawmaker Kim Byung-ki, while the company is challenging a separate six-month partial business suspension over Anti-Money Laundering violations. A Seoul court stayed the suspension in April pending a ruling in Bithumb’s challenge.Magazine: Korean bank taps Ripple for payments, Pakistan opens crypto licensing: Asia Express

