



A weekly WLD chart analysis has identified a possible morning star candlestick pattern near this support zone, raising the prospect of further upside if buyers can sustain the recent momentum.
The pattern alone does not confirm a trend reversal. Worldcoin price remains below several important medium- and long-term moving averages, while the broader technical structure is still recovering from a prolonged decline.
The immediate focus is therefore on whether WLD can clear resistance around $0.35-$0.38. A sustained move above that region would provide stronger confirmation that the latest rebound is developing into a broader recovery.
WLD recently reacted from a demand zone around $0.30, an area that has attracted buyers during the latest phase of consolidation. The rebound has brought the token back toward the $0.34-$0.35 region, but the recovery has yet to establish a decisive higher-high structure.
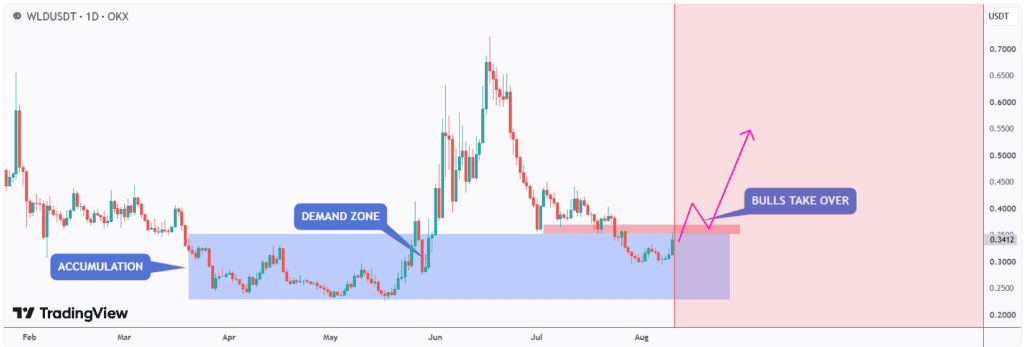
WLD is rebounding from a key demand zone, but bulls need further confirmation to establish a sustained recovery. Source: TheSignalyst on TradingView
Technical analyst TheSignalyst described the setup as one in which “demand is holding, but structure needs to break.” The analysis identifies approximately $0.37-$0.38 as the key level buyers need to overcome before a more convincing bullish shift can be established.
A separate six-hour chart analysis also identified a break above a long-term descending trendline near $0.3396. That setup places approximately $0.3340 as a nearby support level, while $0.38-$0.40 represents the next major resistance area.
The recent rebound has also occurred alongside developments that have increased attention around Worldcoin. Eightco Holdings reported in July that it held more than 283 million WLD tokens as part of a broader treasury containing digital assets and technology investments.
Grayscale has also filed an S-1 registration statement for a proposed spot Worldcoin ETF that would trade under the ticker GWLD on Nasdaq, subject to regulatory approval. WLD rose sharply following reports of the filing, although the proposed fund remains dependent on the regulatory process.
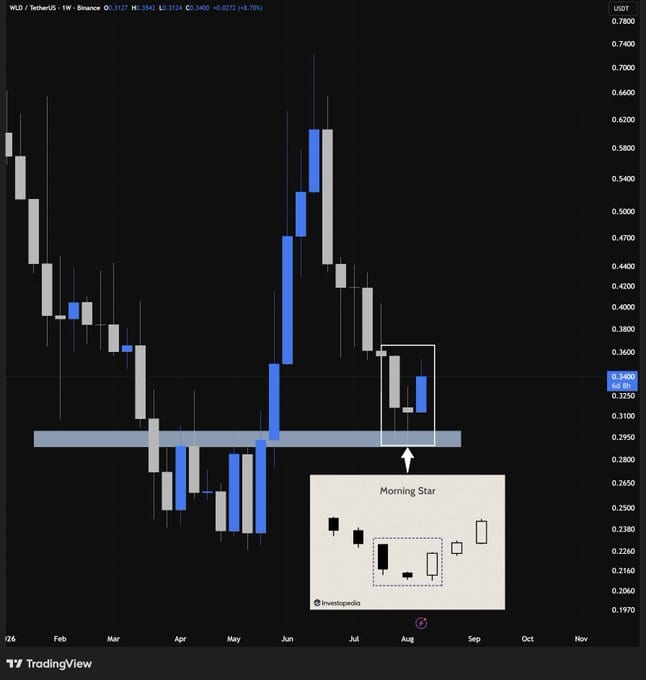
A potential weekly morning star reversal pattern has emerged near WLD’s $0.30 support, signaling a possible shift toward bullish momentum. Source: @Nebulabsxyz via X
A potential morning star pattern on the weekly chart has added another bullish signal to the setup. The formation generally consists of a large bearish candle, a smaller middle candle, and a subsequent bullish candle. It can indicate that selling pressure is weakening after a sustained decline.
In WLD’s case, the pattern has emerged near the $0.30 support area. The analysis from crypto trader @Nebulabsxyz points toward $0.44 and $0.50 as potential upside levels if the reversal develops and momentum remains strong.
However, confirmation remains important. Traders typically look for follow-through buying and a decisive close above the pattern’s relevant resistance before treating a morning star as a confirmed reversal rather than an early signal.
TradingView’s technical readings present a mixed picture. The overall technical summary remains Neutral, reflecting the lack of a decisive trend across the indicator set.
The Relative Strength Index (RSI) is around 48.9, placing it near the midpoint of its range. This suggests that WLD is neither in a conventional overbought nor oversold condition.
Other oscillators also remain largely neutral. Stochastic %K is around 48.6, while the Commodity Channel Index is near 11.4. The Average Directional Index stands near 26, indicating some trend strength but not an especially strong directional move.
Momentum and MACD provide more constructive signals. Momentum is registering a Buy reading, while the MACD level is also classified as Buy in the referenced technical breakdown.
At the same time, the elevated Stochastic RSI and Williams Percent Range readings suggest that the recent rebound has already generated stronger short-term momentum. That does not necessarily mean a reversal is complete, but it does highlight the possibility of consolidation if buyers struggle to push through resistance.
Overall, the oscillator configuration supports the idea of improving short-term momentum without providing enough evidence to confirm a sustained bullish trend.
Moving averages show a clearer divide between short-term recovery and the broader trend.
WLD is trading above several short-term averages, including the 10-period EMA near $0.3184, the 20-period EMA around $0.3304 and the 20-period SMA near $0.3260. The 10-period and 20-period averages are therefore providing a constructive backdrop for the latest rebound.
The longer averages remain more challenging. The 30-period EMA is around $0.3454, while the 50-period EMA is near $0.3649. The 100-period EMA is approximately $0.3790, placing several important trend references directly around the $0.35-$0.38 resistance zone.
The 200-period EMA is considerably higher near $0.4339. That level is particularly relevant because it sits close to the $0.44 target highlighted by the weekly morning star analysis.
This configuration shows why the current move should be viewed as a developing recovery rather than an established long-term reversal. WLD has reclaimed several short-term averages, but it still needs to recover the higher-period averages to demonstrate broader trend improvement.
The Ichimoku Base Line is also around $0.3525, adding another layer of resistance close to the current price area.
Pivot calculations provide additional reference levels for the Worldcoin price prediction.
The classic pivot is around $0.3482, placing WLD near an important decision point. The first major resistance under the classic calculation is approximately $0.4011, followed by $0.5025.
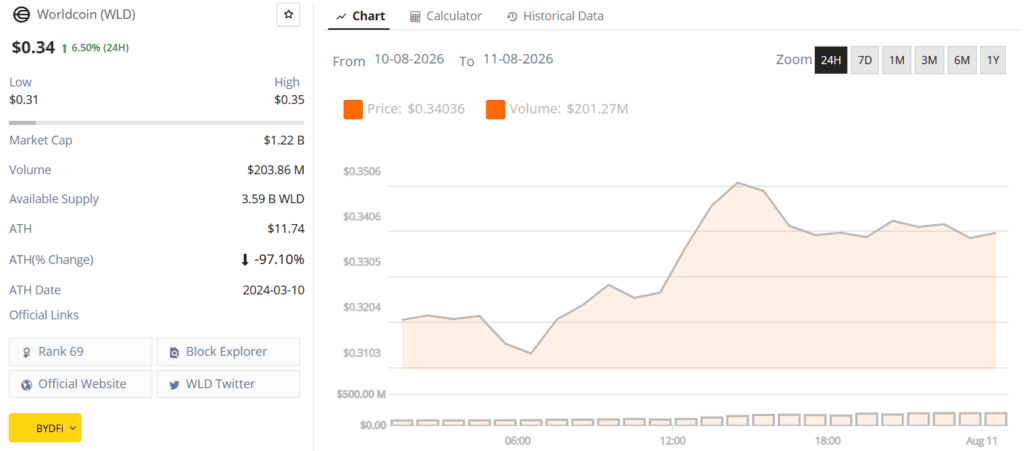
Worldcoin (WLD) price chart. Source: Brave New Coin
Fibonacci pivot calculations place the first resistance near $0.4071, while Woodie’s first resistance is around $0.3771.
These levels broadly reinforce the importance of the $0.35-$0.40 region. A move through $0.35 would put the token closer to the $0.38-$0.40 resistance band identified by multiple technical analyses.
On the downside, the $0.30-$0.32 area remains an important support cluster. A loss of that zone would weaken the current reversal structure and could bring deeper support areas back into focus.
The pivot structure therefore presents a relatively clear framework: $0.30-$0.32 is the main downside reference, while $0.35-$0.40 represents the first major upside hurdle.
WLD has been trading within a broader declining structure for much of 2026, making the latest rebound significant but not yet conclusive.
Recent price action has concentrated roughly between $0.29 and $0.36, with the August 10 advance carrying WLD toward the upper end of that range before some rejection. The move from the $0.30 area has consequently improved the short-term structure, but the price remains below several higher-timeframe resistance levels.
The potential weekly morning star is important because it has appeared close to a major support area rather than after an extended rally. If buyers can follow through, the formation could provide an early indication that the long decline is losing momentum.
Still, the $0.35-$0.355 region remains an immediate test. It overlaps with several technical references, including the 30-period moving averages and the Ichimoku Base Line. A sustained move above this area would improve the short-term structure.
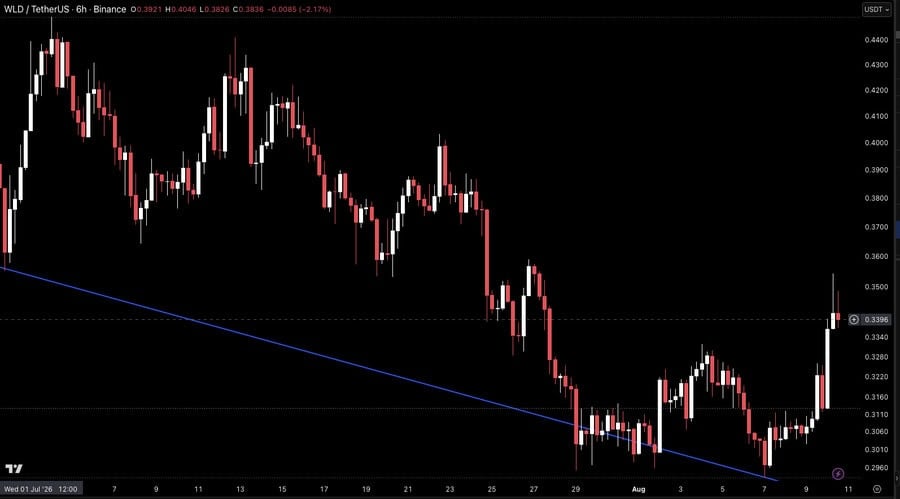
WLD broke its long-term descending trendline near $0.3396, with $0.3340 as key support and $0.38-$0.40 as the next major resistance zone. Source: @Binance_Killers via X
The next challenge would come around $0.37-$0.40. This zone includes the previous local high identified by TheSignalyst, the descending-trendline breakout area, and several pivot-based resistance levels.
If WLD eventually clears that broader resistance band, the $0.44 area becomes a more relevant technical objective. It also coincides closely with the 200-period EMA cited in the TradingView data.
A move toward $0.50 would represent a substantially larger extension and would require considerably stronger momentum than the market has demonstrated so far. The level is therefore better viewed as a conditional target rather than an established forecast.
The fundamental backdrop has also become more notable. Eightco reported holding 283 million WLD as of July 2026, giving the company substantial exposure to the token. Meanwhile, Grayscale’s proposed Worldcoin ETF could potentially create another regulated avenue for market exposure if it receives approval.
World Chain’s broader development is another factor worth monitoring. The network is designed to support the World ecosystem and increase transaction capacity, making future upgrades relevant to the project’s broader adoption prospects.
These developments may influence market sentiment, but WLD’s immediate price direction remains dependent on its technical structure and broader cryptocurrency market conditions.
In the near term, the $0.30-$0.32 support zone and $0.35-$0.40 resistance band are the most important levels to monitor. Holding support while establishing higher highs would strengthen the bullish case. Conversely, a return below $0.30 would weaken the morning-star setup and suggest that buyers have not yet secured control.
The Worldcoin (WLD) price prediction outlook has improved after the token rebounded from the $0.30 support region and formed a potential weekly morning star pattern. Short-term moving averages and selected momentum indicators are also showing signs of improvement.
However, the broader trend remains unresolved. WLD must first overcome resistance around $0.35-$0.38 and then the $0.40 area before the recovery can be considered technically significant.
A sustained breakout could place $0.44 in focus, with $0.50 representing a more ambitious upside level highlighted by the bullish chart scenario. For now, those targets remain conditional on continued buying pressure and confirmation from higher-timeframe price action.
The technical picture is therefore constructive but incomplete. The $0.30-$0.32 zone remains the key support area, while $0.35-$0.40 is the critical resistance region that could determine whether the current rebound develops into a larger Worldcoin recovery.







USBC increased a Bitcoin-backed loan to $18 million in late July. That created a price-dependent risk: the company could have to add collateral or repay
Strategy’s Bitcoin sales highlight a shift towards active capital management, potentially influencing corporate strategies in crypto asset handling. The post Strategy CEO Phong Le says
Spark Protocol’s proactive risk management through rate limits highlights the importance of structural safeguards in DeFi, fostering trust and growth. The post Spark Protocol’s rate
The SEC’s action against Adit Ventures highlights the critical need for transparency and accountability in venture capital management. The post SEC charges Adit Ventures Management
