



The Elliott Wave Forecast sees XAG/USD headed lower, and the current price action indicates that buyers are holding up on the move.
Notably, the analyst forecast shows that XAG/USD will fall first before buyers come in. After reaching the top $60 range, the analyst has been able to identify a corrective structure forming in the 4-hour chart of the silver price.
The chart from analyst Elliottwave suggests the current price is around $63.41 and anticipates more downward movement towards $58-$60. There are several Elliott Wave labels showing the potential corrective path, and the move itself is a lower structure in preparation for a potential recovery.
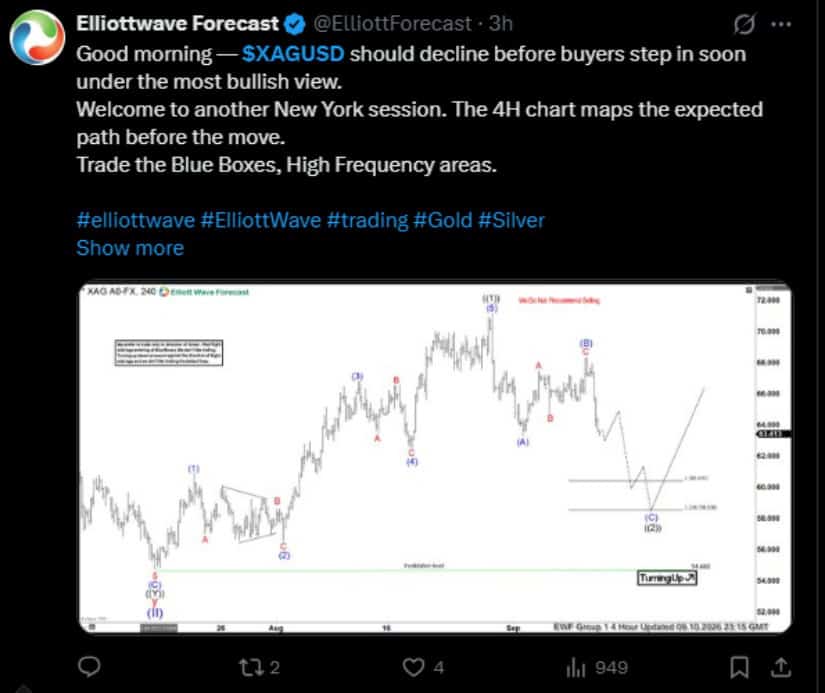 The overall chart setup indicates that traders need to be aware of the $60 zone. If it declines below this level, the next support area around $58 would be in view. Source: Elliott Wave via X
Yet the chart also indicates a possible bounce-off and bounce-back above the correction, with silver ultimately returning towards the $66 level.
The Elliott wave forecast is thus a two-stage setup. A downtrend of silver might weaken before buyers start to make another push up. That is why the correction zone is crucial for traders who are monitoring the upcoming direction.
Meanwhile, another analyst chart from Bull Theory reveals a dramatic response in both gold and silver after the latest inflation report in the United States. Silver rallied sharply from about $63.8 to +$65, and gold rallied strongly as well.
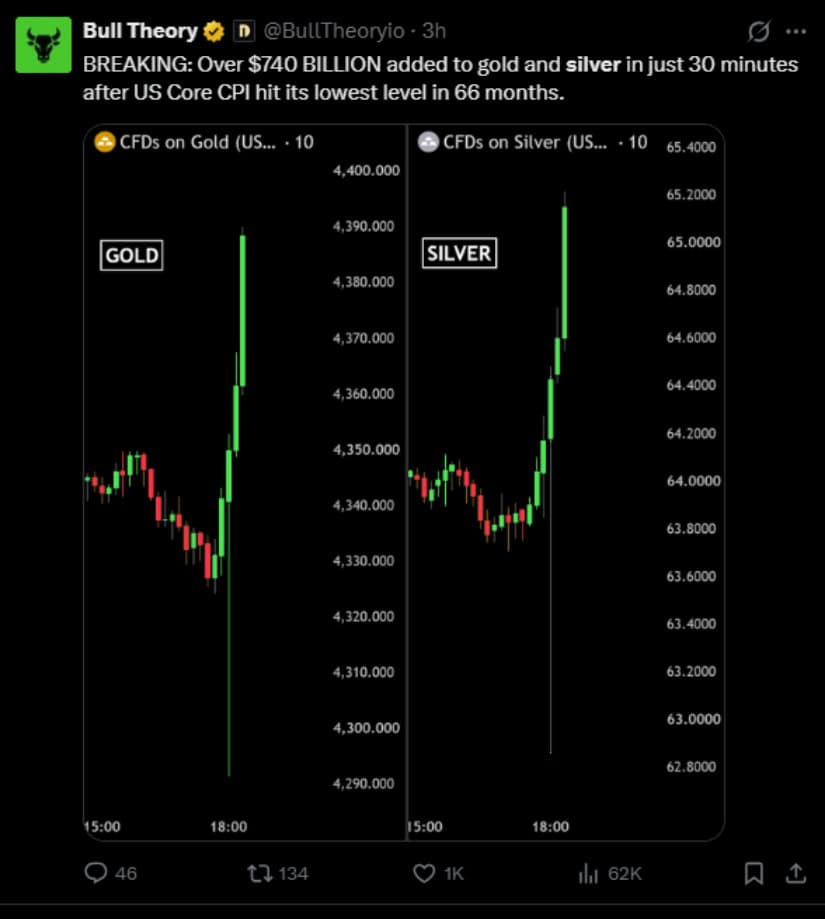 According to Bull Theory, more than $740 billion has flowed into core CPI gold and silver exposure in just 30 minutes since the monthly data was the lowest in 66 months for the annual rate. Source: Bull Theory Via X
Official August figures indicated the core CPI edged down to 2.4% from 2.5% in July.
But the inflation report also raised the pressure on the Fed to tighten policy, providing a conflicting background for non-yielding metals. Silver was trading at around $64.43, up about 1.4% on Friday, Reuters reported.
Silver bulls are still ahead for the short term, but the Elliott Wave Forecast chart suggests otherwise, as it indicates that the rally could plateau or lose ground without a pullback. Breaking above $65 – $66 will call into question the bearish correction scenario.
On the other hand, a rejection there may cause XAG/USD to approach the $60 and $58 support areas shown on the 4-hour chart. Silver traders should thus be alerted to whether the price can sustain its rally following the CPI release or begins the correction as forecasted by the Elliott Wave Forecast.
Silver futures are running around $65.70, up 1.19% despite a disappointing week for miners. Traders are pushing the metal to a new high, as silver futures are around $65.70, rising 1.19% despite a weak week for miners.
The price is above the recent highs, which indicates higher buying pressure in the short term.
If prices continue to rise above the $65.70 level, then a further rise to the $66.00 level might be possible.
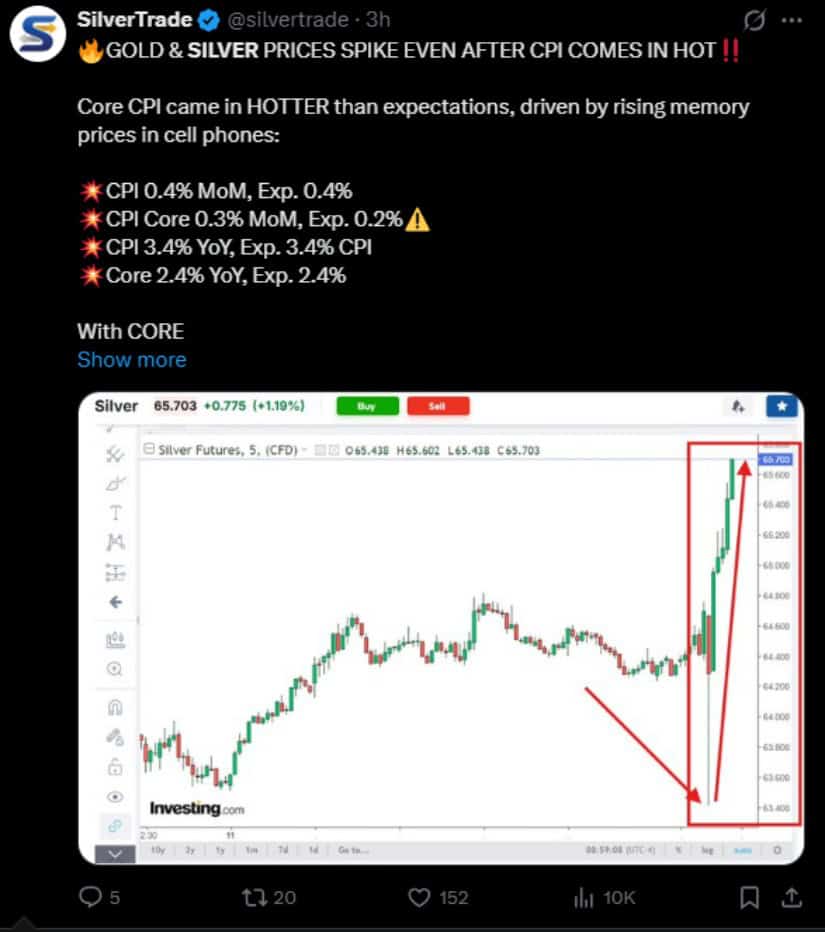 A new surge comes after much warmer-than-expected core CPI readings that put precious metals back in focus. Source: Silver Trade via X
Silver is also making a significant move up from a previous trading range of $64.20–$64.40.
There is another key support at $65.00 and then the breakout area around $64.60.
Maintaining these levels could continue the bullish pattern in the upcoming sessions.
In the meantime, buyers have the momentum, as the chart made a sharp vertical move.
A move above $66.00 would help confirm the potential for an upward move to $66.50.
But a rejection near $66 may lead to a retest at $65.00, with a subsequent move up in play next.
In the meantime, silver bulls are in control, and it’s above the recent breakout zone.







Federal authorities restrained about $52 million in scam-linked cryptocurrency in a single day during a crackdown on Xinbi Guarantee, lifting the Justice Department strike force’s
Ethereum’s latest recovery has returned price above $2,500, but the broader setup remains vulnerable as price trades near resistance while open interest and trading volume
BRICS’ support may enhance Palestine’s international recognition prospects, potentially influencing global diplomatic dynamics and market perceptions. The post Palestine welcomes BRICS support for two-state solution
Whale accumulation amid LINK’s price dip suggests robust confidence in Chainlink’s long-term potential, despite short-term market volatility. The post Whales accumulate 10M LINK after 17%
