

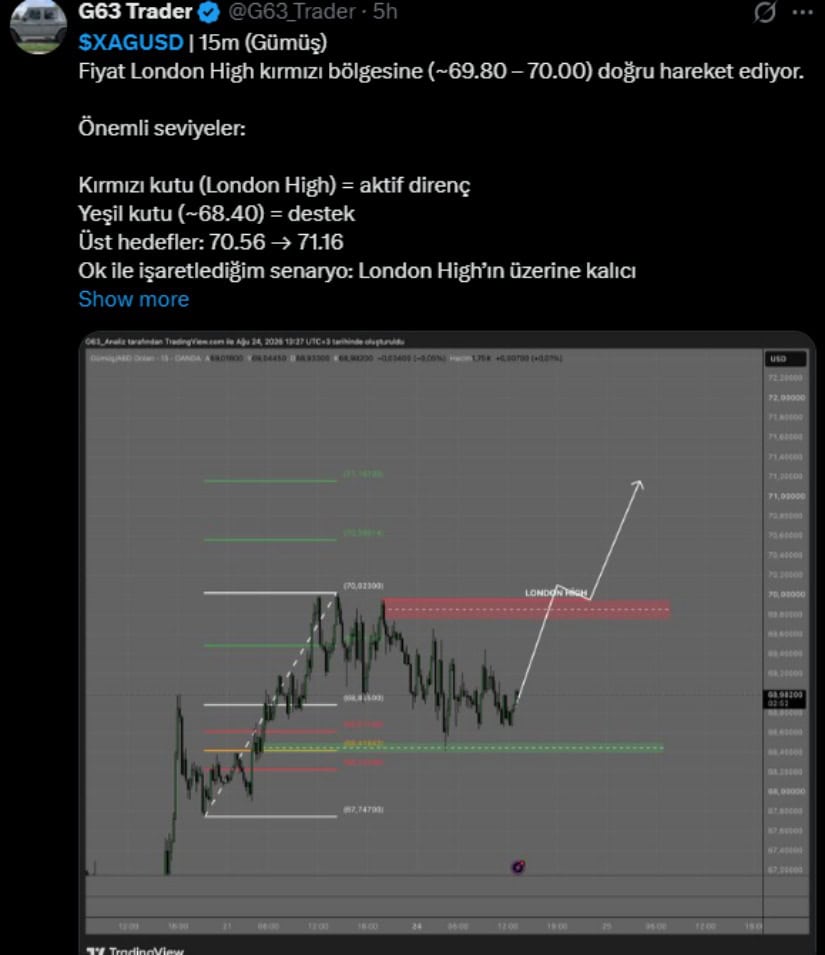
The stock is heading back to the 69.80-70.00 zone following its brief dip in the day. This area is identified on the 15-minute chart as the London high and active resistance.
The current chart shows that silver is trading below the resistance level at $68.92. The buyers have been pushing the price higher off the bottom of the range recently.
$68.40 is also a nearby support level that is identified on the chart. This level is below the current price and could be the next level to watch on further intraday moves.
The price is currently consolidating in an upward trend from a range after a few days of sideways action. Multiple candles have been developing around the bottom end prior to the recent counter-trend move upward toward resistance.
The chart of XAGUSD has the primary resistance level at 69.80-70.00. Should silver move into this area, it would be returning to the recent intraday high.
There is no sign of a breakout above the zone on the chart. Rather, it offers an opportunity to see the price remaining above the London high in order to keep the upward setup in play.
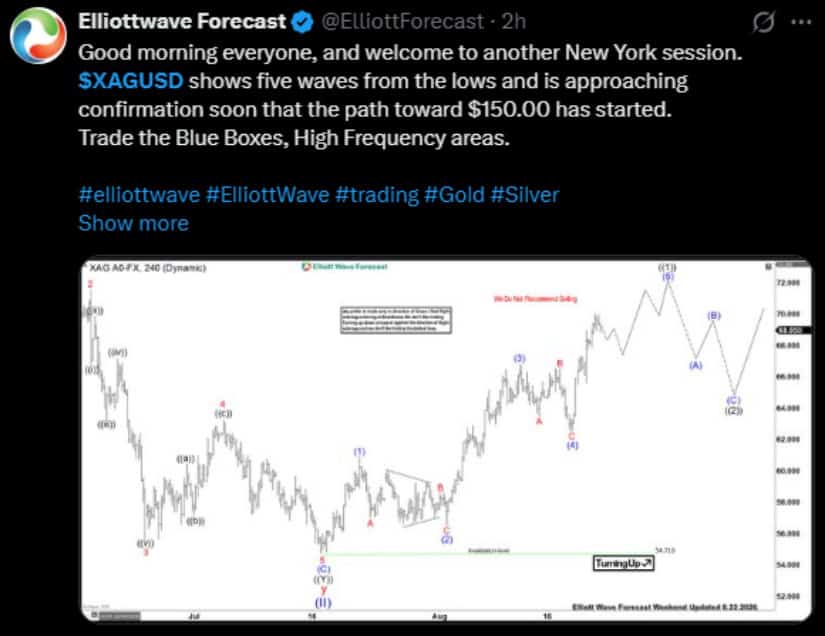 XAGUSD’s next marked levels are $70.56 and $71.16. These levels are marked above the resistance zone and represent the resistance (or upside targets) that are indicated in the technical setup. Source: Elliott Wave forecast via X
The market is also poised to test the marked ceiling, with the price still far from $70 resistance. If the price action around that zone continues and it breaks higher, then the range will extend.
The $68.40 price level is the primary reference that supports the price on the provided 15-minute chart.
A return to this level would put the price in the lower part of the current structure.
There are a number of previous reactions that occurred around the $68.40 mark. Price rebounded from a trade just below this support level, pushing higher once more towards the London high.
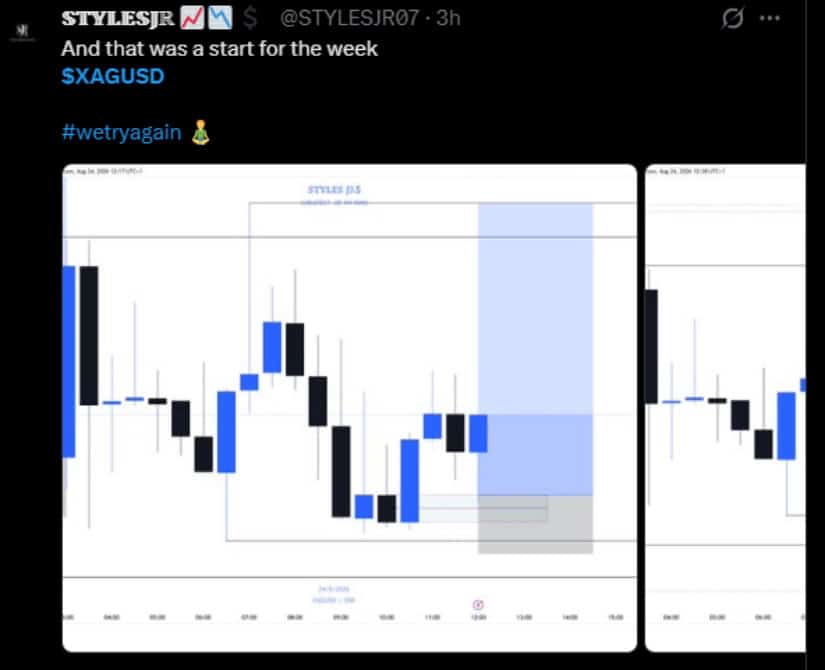
 A single time frame chart depicts silver in action with a series of bullish and bearish candles. The price action that has recovered from a decline has found itself in a narrower price range.
The second graph also reflects that buyers switched from the downtrend after the price declined. Looking at the newest candles, there do seem to be signs of a consolidation near the top of that short-term recovery.
The technical setup provides a good separation of the levels, with the nearby support around $68.40 and the resistance zone around the 69.80-70.00 range.
 $70.56 is the first level of support above resistance. The next target is $71.16, which is beyond the London high and is the next marked target. Source: Stylesjr Via X
If it continues to rise from $70.00, it will be on the radar. If it is rejected from the resistance area, then the next chart reference would be $68.40.
The charts provided as a result of this are therefore given a clearly defined short-term structure, with resistance around $70 and support around $68.40.







Three days in August did more for sentiment than the previous three months. ChatGPT AI predicts that the shift holds, and the price prediction places
Can a single upgrade close a gap of more than 50%? That is the question behind the latest Claude AI price prediction, where the model
A rally of a few days has repriced an entire year of drift. The latest Microsoft Copilot AI price prediction leans into that, and the
Chelsea’s promising attack under Alonso could boost title hopes, but unresolved defensive frailties may undermine long-term success. The post Chelsea shows promise under Xabi Alonso

