

XRP price started a downside correction below the $1.3420 zone. The price is now showing bearish signs and might decline further below $1.3150.
XRP price struggled to stay above $1.3520 and started a fresh decline, like Bitcoin and Ethereum. The price dipped below the $1.350 and $1.3450 levels.
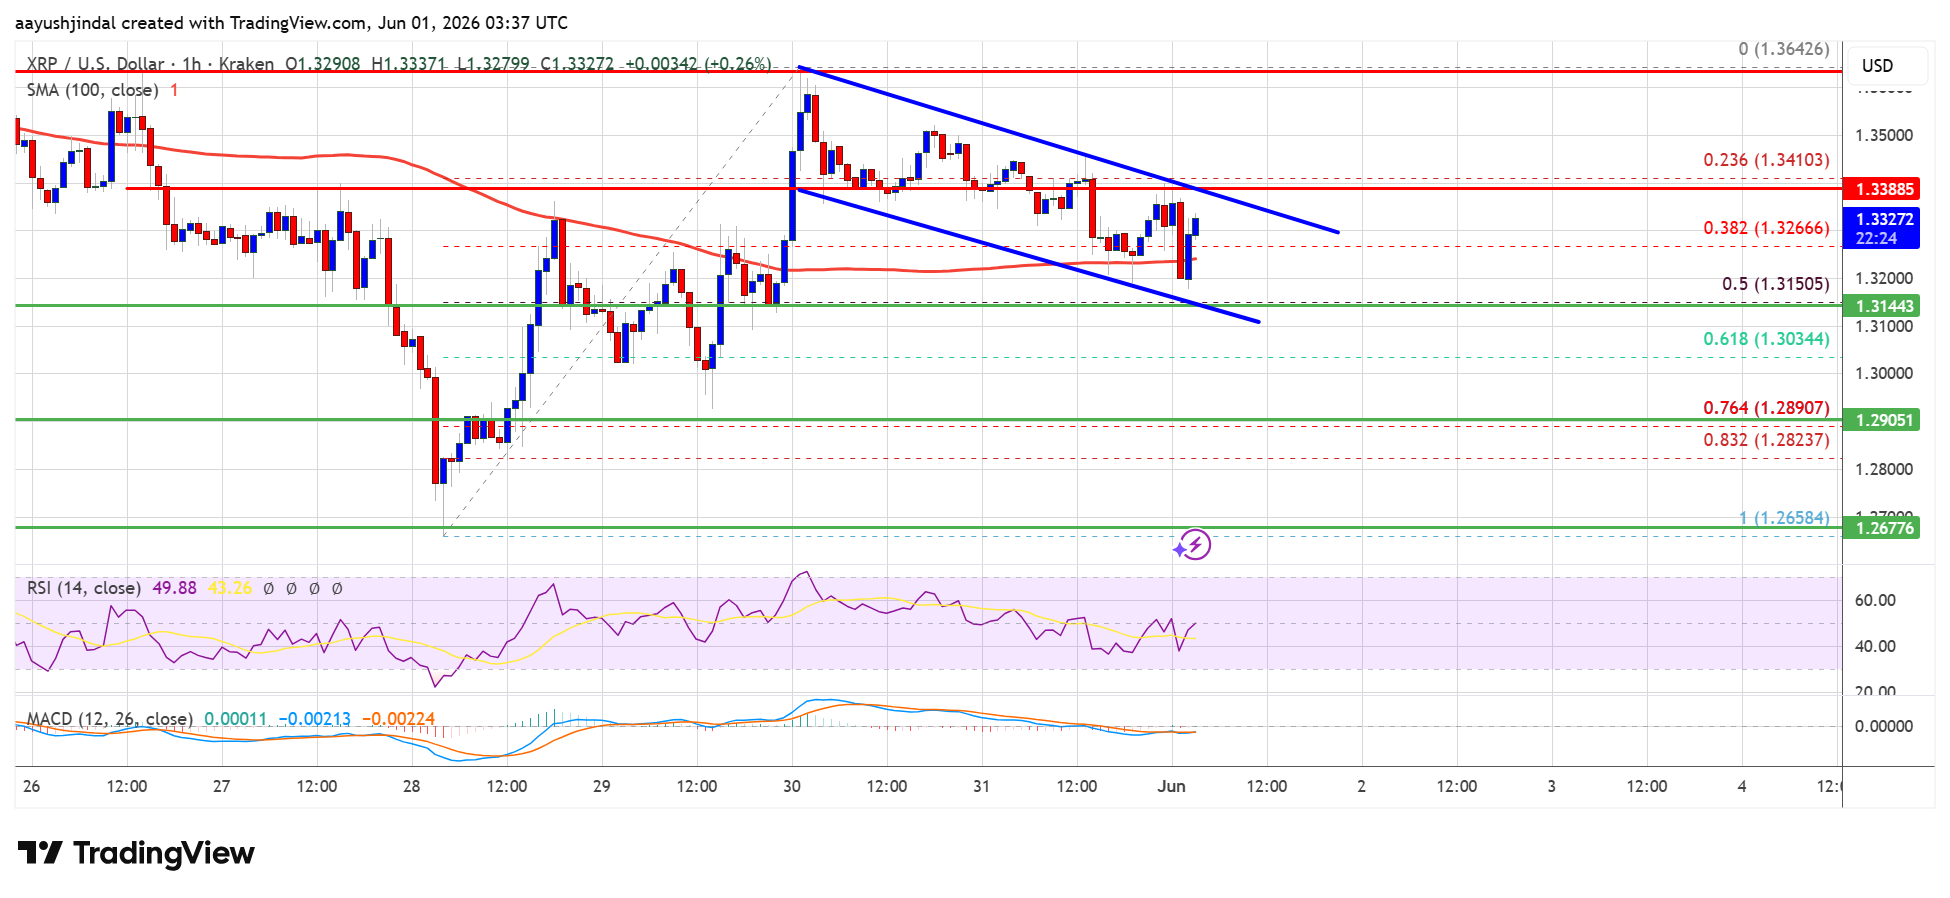
The price declined below $1.3420. There was a clear move below the 38.2% Fib retracement level of the upward move from the $1.2658 swing low to the $1.3642 high. Besides, there is a declining channel forming with resistance at $1.3380 on the hourly chart of the XRP/USD pair.
The price is now trading above $1.3150 and the 100-hourly Simple Moving Average. If there is a fresh upward move, the price might face resistance near the $1.3380 level. The first major resistance is near the $1.3420 level, above which the price could rise and test $1.350.
A clear move above the $1.350 resistance might send the price toward the $1.3580 resistance and the trend line. Any more gains might send the price toward the $1.3650 resistance. The next major hurdle for the bulls might be near $1.3740.
If XRP fails to clear the $1.3380 resistance zone, it could start a fresh decline. Initial support on the downside is near the $1.320 level. The next major support is near the $1.3150 level and the 50% Fib retracement level of the upward move from the $1.2658 swing low to the $1.3642 high.
If there is a downside break and a close below the $1.3150 level, the price might continue to decline toward $1.3120. The next major support sits near the $1.3050 zone, below which the price could continue lower toward $1.2920. Any more losses might call for a test of $1.2880.
Technical Indicators
Hourly MACD – The MACD for XRP/USD is now gaining pace in the bearish zone.
Hourly RSI (Relative Strength Index) – The RSI for XRP/USD is now below the 50 level.
Major Support Levels – $1.3200 and $1.3150.
Major Resistance Levels – $1.3380 and $1.3500.


The contrasting market trends highlight AI’s transformative potential against geopolitical risks, underscoring the delicate balance investors face. The post Asia stocks rise on AI demand
MEXC’s RealStocks could redefine access to US equities for crypto users, potentially bridging financial ecosystems and expanding market participation. The post MEXC launches RealStocks for

Bitgo CEO Mike Belshe claims that the Markets in Crypto Assets (MiCA) framework puts the entire stablecoin ecosystem in danger by forcing issuers to hold
The escalation near the Strait of Hormuz heightens regional instability, potentially impacting global energy markets and military strategies. The post Iran and US exchange air