XRP price extended losses and traded below $1.40. The price is now consolidating losses and faces hurdles near $1.3980 and $1.40.
XRP price failed to stay above $1.4050 and extended its decline, like Bitcoin and Ethereum. The price declined below $1.4020 and $1.40 to enter a short-term bearish zone.
The price even extended losses below $1.380. A low was formed at $1.3680, and the price is now consolidating losses. There was a minor recovery wave toward the 23.6% Fib retracement level of the downward move from the $1.4470 swing high to the $1.3680 low. Besides, there was a break above a bearish trend line with resistance at $1.3820 on the hourly chart of the XRP/USD pair.
The price is now trading below $1.40 and the 100-hourly Simple Moving Average. If there is a fresh recovery move, the price might face resistance near the $1.3980 level.
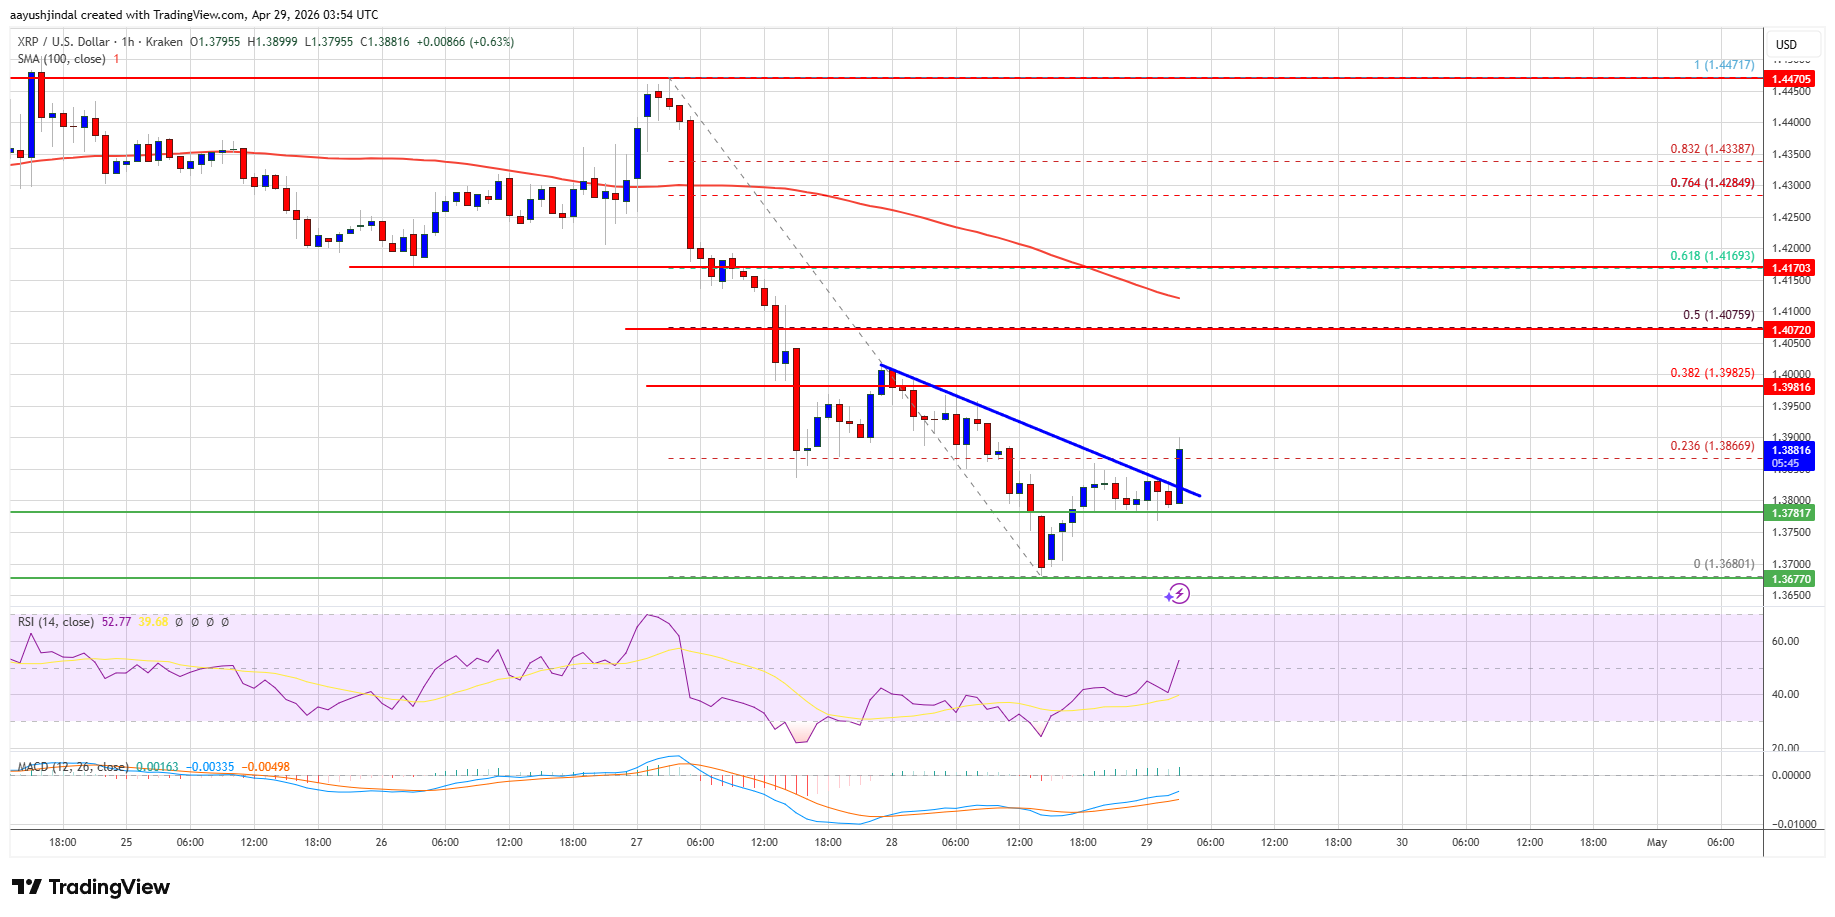
The first major resistance is near the $1.4075 level or the 50% Fib retracement level of the downward move from the $1.4470 swing high to the $1.3680 low. The main resistance could be $1.4170. A close above $1.4170 could send the price to $1.4220. The next hurdle sits at $1.4250. A clear move above the $1.4250 resistance might send the price toward the $1.450 resistance. Any more gains might send the price toward the $1.4650 resistance.
If XRP fails to clear the $1.3980 resistance zone, it could start a fresh decline. Initial support on the downside is near the $1.3780 level. The next major support is near the $1.3680 level.
If there is a downside break and a close below the $1.3680 level, the price might continue to decline toward $1.3550. The next major support sits near the $1.350 zone, below which the price could continue lower toward $1.3220.
Technical Indicators
Hourly MACD – The MACD for XRP/USD is now losing pace in the bearish zone.
Hourly RSI (Relative Strength Index) – The RSI for XRP/USD is now below the 50 level.
Major Support Levels – $1.3780 and $1.3680.
Major Resistance Levels – $1.3980 and $1.4000.


Wealthy crypto investors are increasingly concentrating fresh capital in major, high-liquidity tokens—a positioning shift that underscores a flight toward perceived safety even as pockets of

Ripple custody strategy gains traction as European institutions move into production environments requiring secure digital asset infrastructure. The shift positions custody systems as the operational

The US Commodity Futures Trading Commission on Tuesday sued the state of Wisconsin in the agency’s latest effort to assert jurisdiction over prediction markets after the state sued multiple platforms.The CFTC said in a statement that it filed the lawsuit against Wisconsin “in response to the state’s lawsuits against Kalshi, Polymarket, Crypto.com, Robinhood, and Coinbase, five CFTC-regulated prediction markets.”“States cannot circumvent the clear directive of Congress,” CFTC Chairman Michael Selig said. “Our message to Wisconsin is the same as to New York, Arizona, and others: if you interfere with the operation of federal law in regulating financial markets, we will sue you.”It is the agency’s fifth lawsuit against a US state that seeks to halt action against prediction markets. The CFTC sued New York on Friday and filed lawsuits against Arizona, Connecticut, and Illinois earlier this month after the states sued prediction market platforms.Michael Selig speaking on stage at Bitcoin 2026 in Las Vegas on Monday. Source: YouTubeWisconsin sued the five companies on Thursday, and like many US state authorities, argued that prediction markets offering sports-related event contracts are illegal betting that requires state gaming licenses.It is an assertion the platforms and the CFTC have rebuffed in the past, arguing the contracts are regulated only under federal law.The CFTC argued in its latest complaint, filed alongside the Justice Department’s Civil Division in a Wisconsin federal court, that it has “exclusive jurisdiction” over the event contracts on prediction markets, regulated as designated contract markets under federal law.Related: With no bipartisan leadership, CFTC won’t ‘slow down‘ on rulemaking“Wisconsin’s attempt to criminalize and shut down federally regulated markets intrudes on the exclusive federal scheme Congress designed to oversee national swaps markets,” the CFTC wrote in its complaint.The agency asked the court to rule that state gambling laws do not apply to CFTC-regulated designated contract markets and issue a permanent injunction prohibiting Wisconsin from taking action against prediction markets.The CFTC’s complaint also named Wisconsin Governor Anthony Evers, Wisconsin Attorney General Josh Kaul and the Wisconsin Gaming Division and its administrator, John Dillett.The Wisconsin Department of Justice, the state’s Division of Gaming and Governor Evers’ office were contacted for comment.Magazine: How to fix suspected insider trading on Polymarket and KalshiCointelegraph is committed to independent, transparent journalism. This news article is produced in accordance with Cointelegraph’s Editorial Policy and aims to provide accurate and timely information. Readers are encouraged to verify information independently.

Trump’s declaration may stabilize geopolitical tensions, reducing immediate military conflict risks but leaving strategic uncertainties unresolved. The post Trump declares military victory over Iran, reducing
