
XRP price started a downside correction from the $1.3740 zone. The price is now consolidating and might aim for another increase if it stays above the $1.320 zone.
XRP price struggled to stay above $1.3720 and started a fresh decline, like Bitcoin and Ethereum. The price dipped below the $1.3620 and $1.3600 levels.
The price declined below $1.3550 and even spiked below the 50% Fib retracement level of the upward move from the $1.30 swing low to the $1.3740 high. Besides, there is a bearish trend line forming with resistance at $1.360 on the hourly chart of the XRP/USD pair.
The price is now trading below $1.3520 and the 100-hourly Simple Moving Average. If there is a fresh upward move, the price might face resistance near the $1.350 level. The first major resistance is near the $1.3560 level, above which the price could rise and test $1.360.
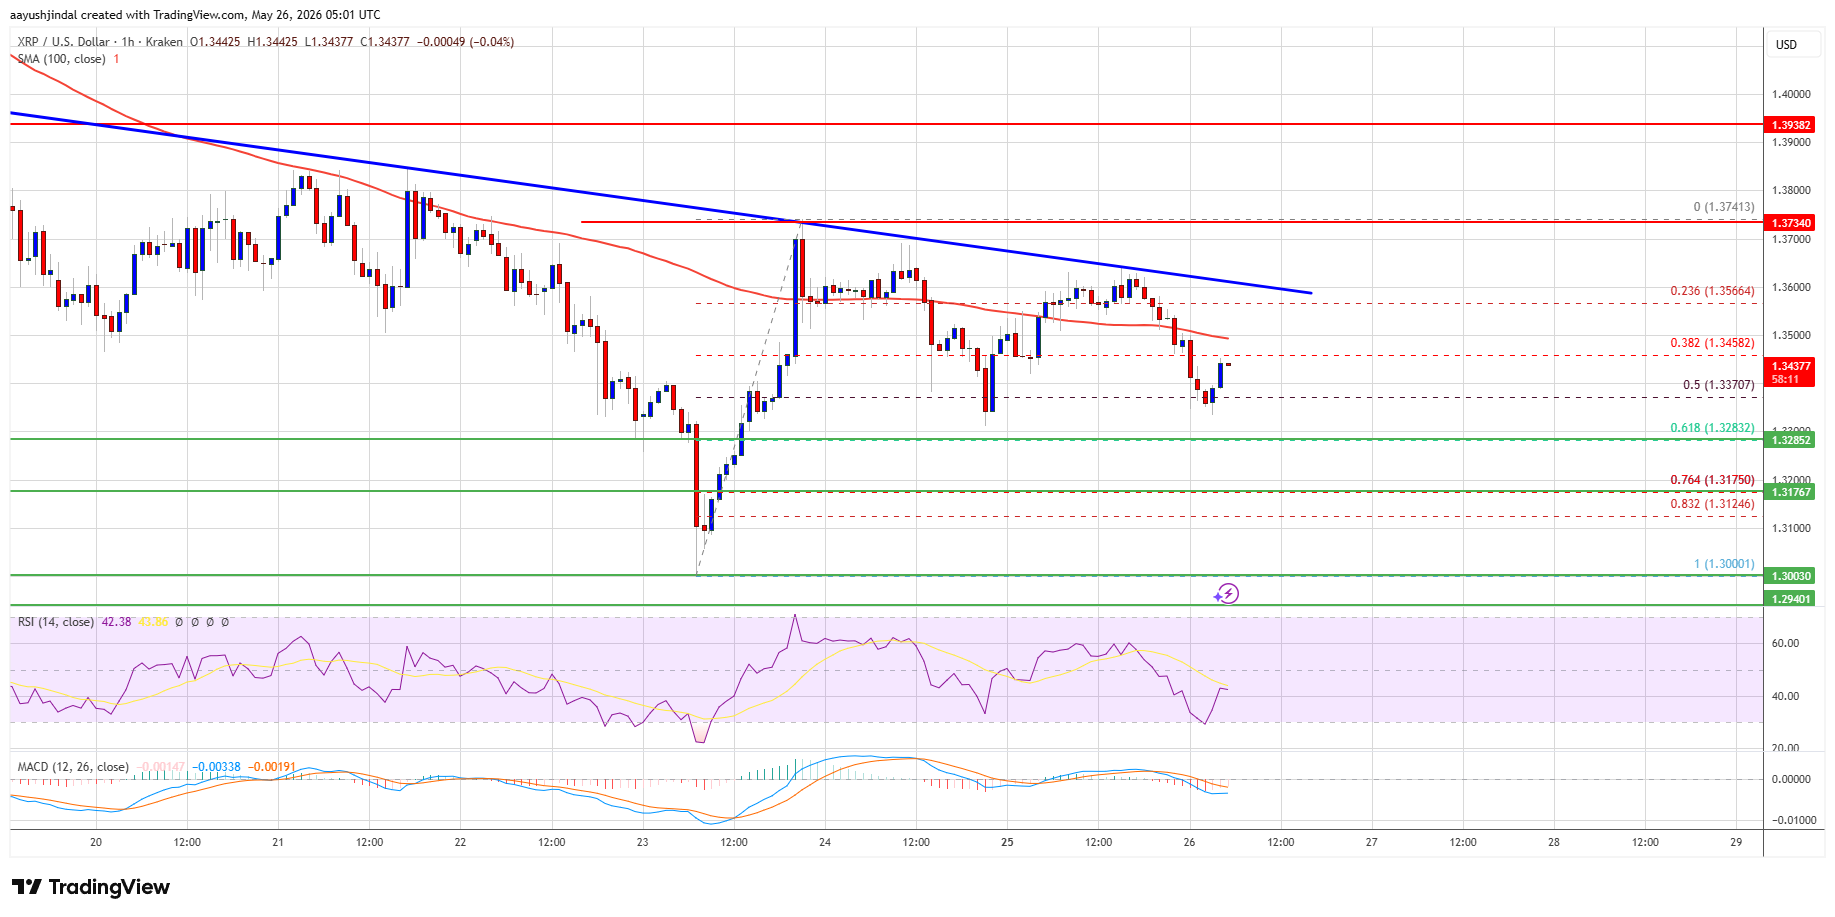
A clear move above the $1.360 resistance might send the price toward the $1.3720 resistance. Any more gains might send the price toward the $1.3750 resistance. The next major hurdle for the bulls might be near $1.380.
If XRP fails to clear the $1.360 resistance zone, it could start a fresh decline. Initial support on the downside is near the $1.330 level. The next major support is near the $1.3280 level and the 61.8% Fib retracement level of the upward move from the $1.30 swing low to the $1.3740 high.
If there is a downside break and a close below the $1.3280 level, the price might continue to decline toward $1.3175. The next major support sits near the $1.3120 zone, below which the price could continue lower toward $1.3050. Any more losses might call for a test of $1.30.
Technical Indicators
Hourly MACD – The MACD for XRP/USD is now gaining pace in the bearish zone.
Hourly RSI (Relative Strength Index) – The RSI for XRP/USD is now below the 50 level.
Major Support Levels – $1.3280 and $1.3120.
Major Resistance Levels – $1.3550 and $1.3750.






Bitcoin price is flying low below $80K, holding a cautious prediction during its recovery, as fresh on-chain data puts a staggering figure. The post Bitcoin

SK Hynix’s iHBM innovation could redefine AI infrastructure efficiency, pressuring competitors to enhance thermal solutions in the HBM market. The post SK Hynix unveils iHBM
Rising oil prices due to geopolitical tensions may prolong inflation, influencing central bank policies and impacting investment strategies. The post Gold slips as US-Iran tensions
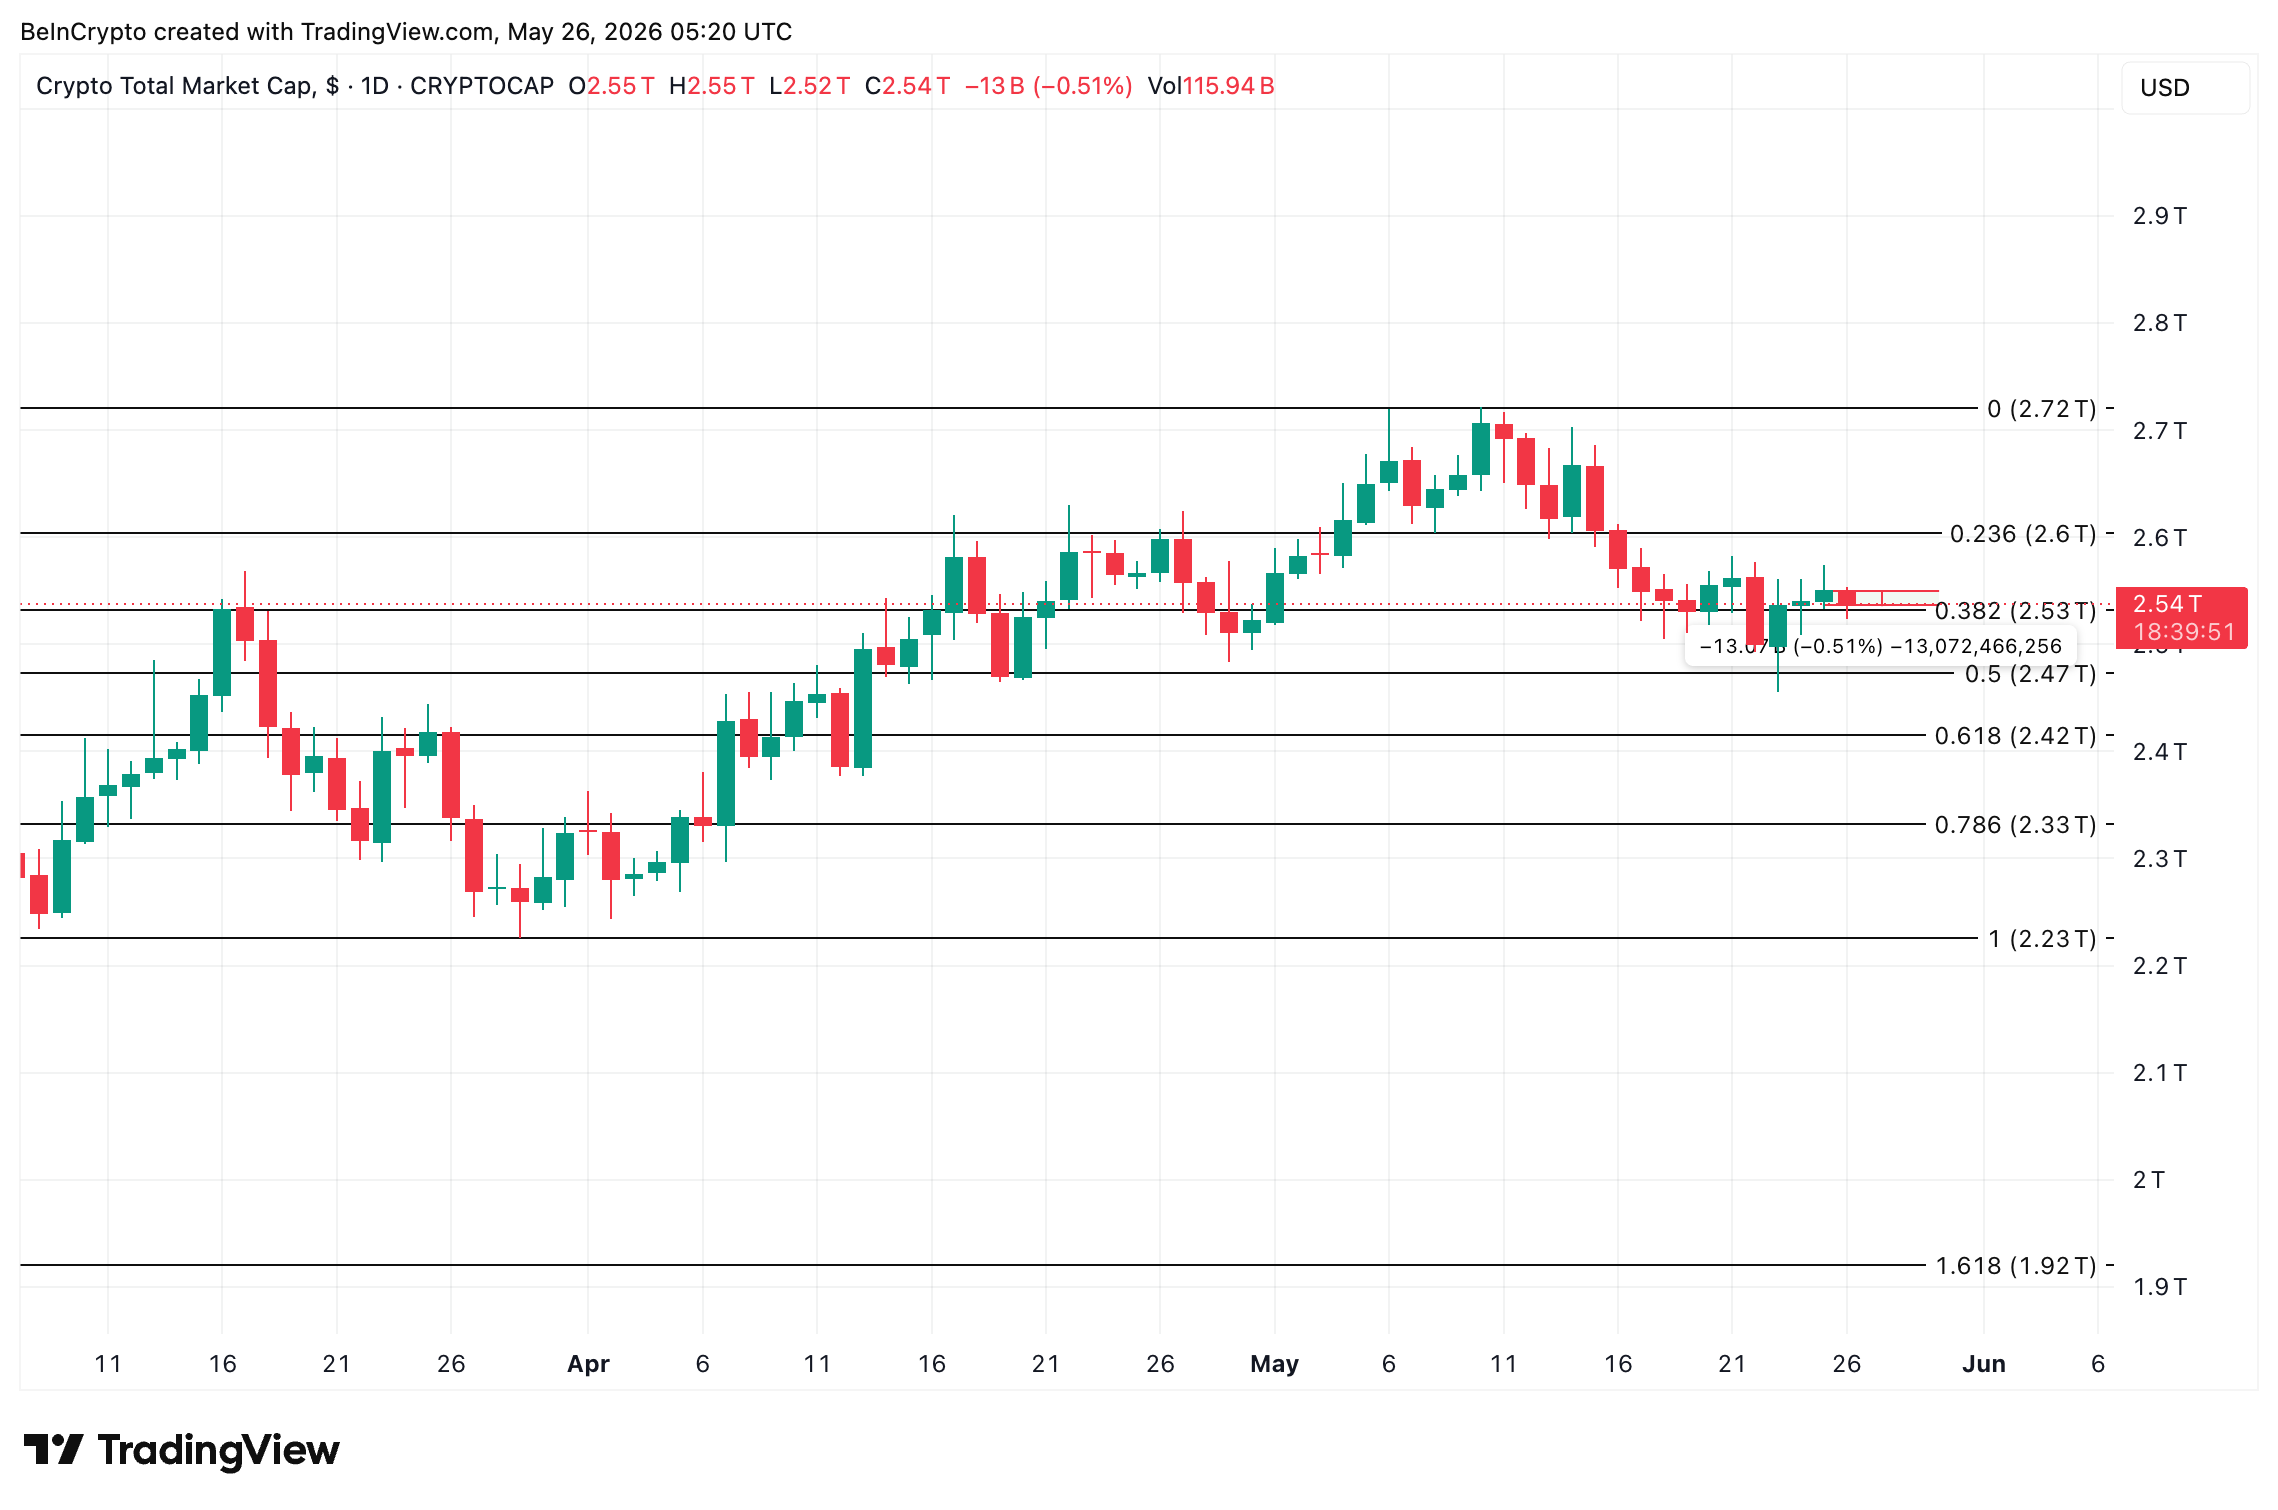
The crypto market is down 0.51% today, shedding roughly $13 billion in valuation as capital keeps rotating toward US equities through a familiar May pattern.

